

Third-quarter results are in, and the Fed decides again on 28 October. Funding costs, a flattening curve and shifting credit risk now drive the US banking sector outlook.
In Summary
Policy sets the frame for the US banking sector outlook. The Fed raised rates to 3.75% to 4.00% in September, its first hike since July 2023. The minutes show most participants expect another rise by year end, and the next decision lands on 28 October.
Third-quarter results beat the gloom. All four of the largest banks grew net interest income, by 5% to 14%.
Margins split by bank. Bank of America gained 15 basis points, JPMorgan 3, while Wells Fargo lost 18.
Credit improved rather than cracked. Every one of the four cut its card loss rate against a year earlier, using Citigroup’s US Consumer Cards measure.
Long rates round-tripped. The 10-year Treasury yield peaked at 5.31% on 5 October, then fell to 4.96% by 22 October.
The fastest-growing large loan category is lending to nondepository financial institutions, up 22.3% in a year to $2.11trn.
Smaller banks earn wider margins. However, Fed H.8 data put CRE at about 44% of loans at domestic banks outside the 25 largest. At the 25 largest, the share is about 11.5%.

The US banking sector outlook shifted on 16 September 2026. That day the Federal Reserve raised interest rates for the first time since July 2023. The Federal Open Market Committee voted 12-0 to lift the target range to 3.75% to 4.00%. Their statement was blunt: “Inflation remains elevated.”
Four weeks later, the evidence arrived. The four largest banks reported third-quarter results on 13 and 14 October, and all four grew net interest income. Credit card losses fell at every one of them. Meanwhile the Fed meets again on 28 October, and its September minutes say most participants expect another increase this year. This analysis, updated to 23 October, weighs the gains against the risks.
What the Fed changed on 16 September
The move was small, but its signal for the US banking sector outlook was large. According to the Fed’s implementation note, interest on reserve balances rose to 3.90%. The discount rate went to 4.00%, both from 17 September. Moreover, the September economic projections, still the most recent set, point to rates staying higher for longer.
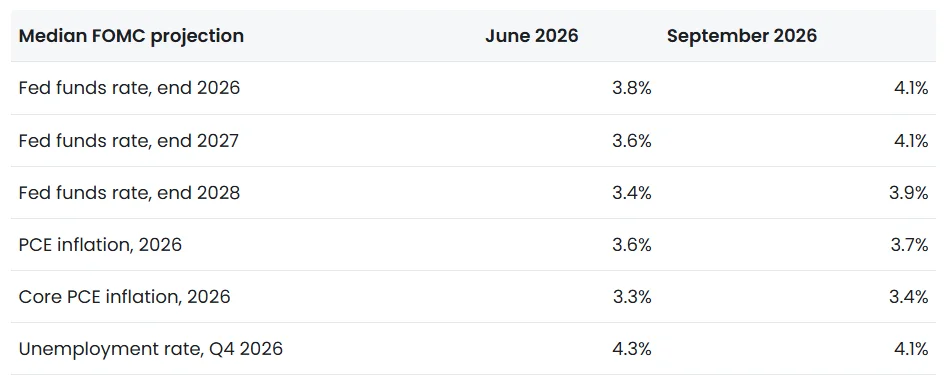
In other words, the median projection implied one more quarter-point hike in 2026 and no cut in 2027. Markets had moved ahead of the Fed. FRED data put the 10-year Treasury yield at 4.96% on 22 October, up from 4.18% at the end of 2025. The 2-year yield rose from 3.47% to 4.65% over the same period. Kevin Warsh, who took office as Fed Chair on 22 May 2026, now leads a committee that has turned hawkish.
What the Fed has signalled since
The minutes, published on 7 October, removed much of the doubt. They state that “most participants assessed that another increase in the target range … would likely be appropriate by year end”. Several participants also described current policy as “not restrictive or only mildly restrictive”.
Inflation data then hardened that case. September consumer prices rose 0.6% in the month and 3.7% over the year. Producer prices jumped 1.3% in the month, for a 6.3% annual rate. The Fed’s Beige Book, published on 14 October, found four Districts reporting a faster pace of price increases. It also noted that “higher oil prices permeated all District reports”.
Officials have since gone quiet, because the pre-meeting blackout began on 17 October. Governor Christopher Waller made the last substantive remarks on the policy path on 8 October. He said that “policy will be focused on the inflation side of our mandate”. Note one practical detail: the October meeting carries no new projections, so the next set of forecasts arrives in December.
Long rates jumped, then fell back
The more important move for banks happened at the long end of the curve. After the hike, the 10-year Treasury yield climbed to 5.31% on 5 October. By 22 October it had dropped to 4.96%. The 30-year peaked at 5.67% and fell to 5.29%, while the 30-year fixed mortgage rate has barely retraced at all.
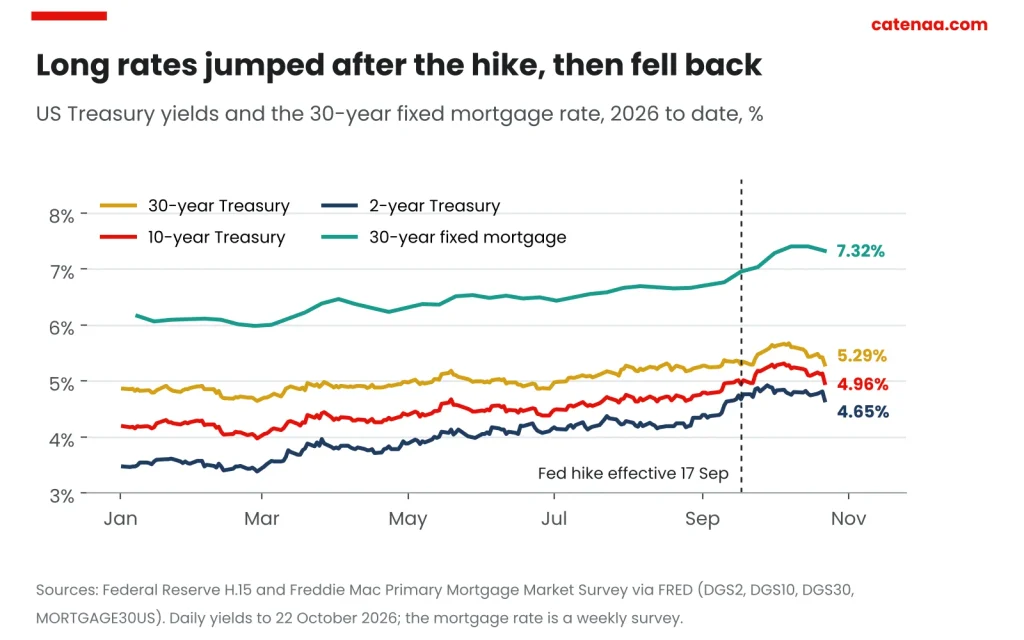
Mortgage borrowers felt the spike, and so did the US banking sector outlook for housing credit. A 30-year fixed loan cost 7.40% in the weeks of 8 and 15 October, the highest of 2026. It then eased to 7.32%. The yield curve has also flattened. The gap between 2-year and 10-year yields narrowed from 0.47 points on 8 October to 0.31 on 22 October. A flatter curve squeezes the spread banks earn on new lending.
What the Q3 results showed
Earnings season settled the first question in the US banking sector outlook. Net interest income rose at all four of the largest banks. JPMorgan reported $27.1bn, up 13%, and Citigroup $17.0bn, up 14%. Bank of America took $16.4bn, up 8%, and Wells Fargo $12.5bn, up 5%.
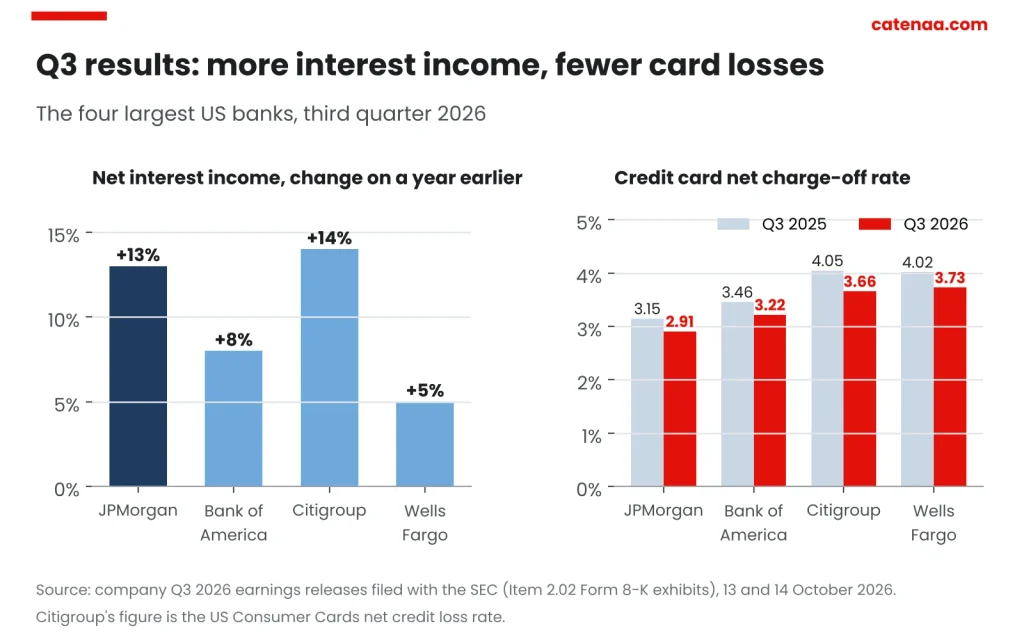
Margins, the core of any US banking sector outlook, moved in different directions. Bank of America’s net interest yield rose 15 basis points from a year earlier, to 2.16%. JPMorgan’s rose 3 basis points, to 2.48%. Wells Fargo’s fell 18 basis points, to 2.43%. Its filing lists “higher deposit costs reflecting growth in interest-bearing commercial deposits” among the drags on net interest income. Citigroup discloses no firmwide margin.
Guidance stayed cautious. Wells Fargo kept its 2026 forecast at “+/- $50 billion, unchanged from prior guidance”. JPMorgan’s outlook implies about $106.2bn for this year, of which roughly $97.2bn sits outside its Markets business. Its preliminary 2027 case puts that same measure near $107bn, citing “balance sheet growth and higher rates”. Bank of America and Citigroup published no full-year interest-income guidance in their filings.
How a rate hike flows into US bank earnings
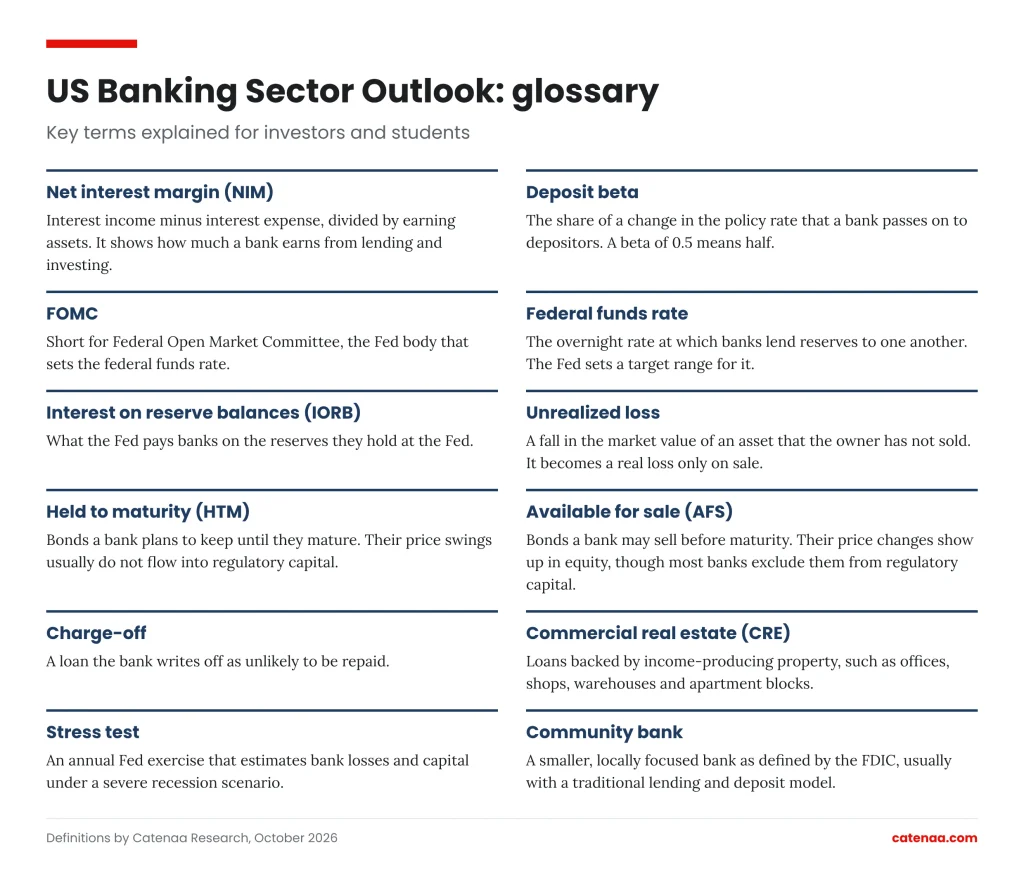
To see why this matters, start with the net interest margin (NIM). It measures what a bank earns on loans and bonds, minus what it pays for funding, against earning assets. When rates rise, loan and bond yields climb. However, deposit costs usually climb too, only more slowly.
For the US banking sector, the outlook starts from a strong position. The FDIC Quarterly Banking Profile shows industry net income of $90.1bn in Q2 2026. That is up 12.0% on the quarter and 28.7% on the year. Return on assets reached 1.37%. The industry margin edged up to 3.32%, from 3.31% in Q1 and 3.26% a year earlier.
Some banks also publish how rates affect them. Bank of America offers an example. It estimates that a one-point rise above the forward curve adds about $1.4bn of net interest income over 12 months. A one-point fall would cut about $1.9bn, according to its Q3 2026 earnings presentation. So a hike helps, and the pain from cuts has narrowed since mid-year.
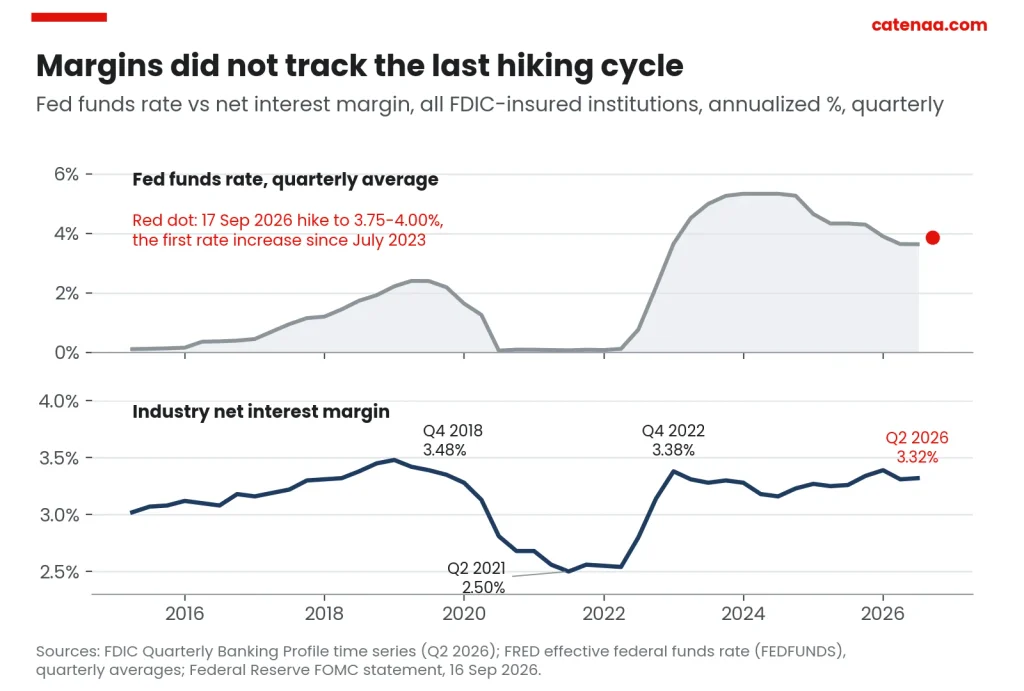
History warns against expecting too much. During 2022 and 2023, the Fed raised rates by 5.25 percentage points. Yet the industry margin peaked for that cycle at 3.38% in Q4 2022, below its 2018 high of 3.48%. It then slid back to 3.16% by Q2 2024, as deposit costs caught up. Tellingly, it later rose to 3.39% in Q4 2025, while the Fed was cutting, before slipping back to 3.32%.
Deposit costs: the swing factor in the US banking sector outlook
Deposit behavior is the key swing factor in the US banking sector outlook. Economists measure it with the “deposit beta”, the share of a rate rise that banks pass on to savers. Catenaa calculated betas from FDIC data for the last cycle. Interest-bearing deposit costs rose about 58 basis points for every 100 of Fed increases. That was the pattern from Q4 2021 to the Q3 2024 peak. Banks with $10bn to $250bn in assets passed on 61 basis points per 100. Community banks passed on 51.
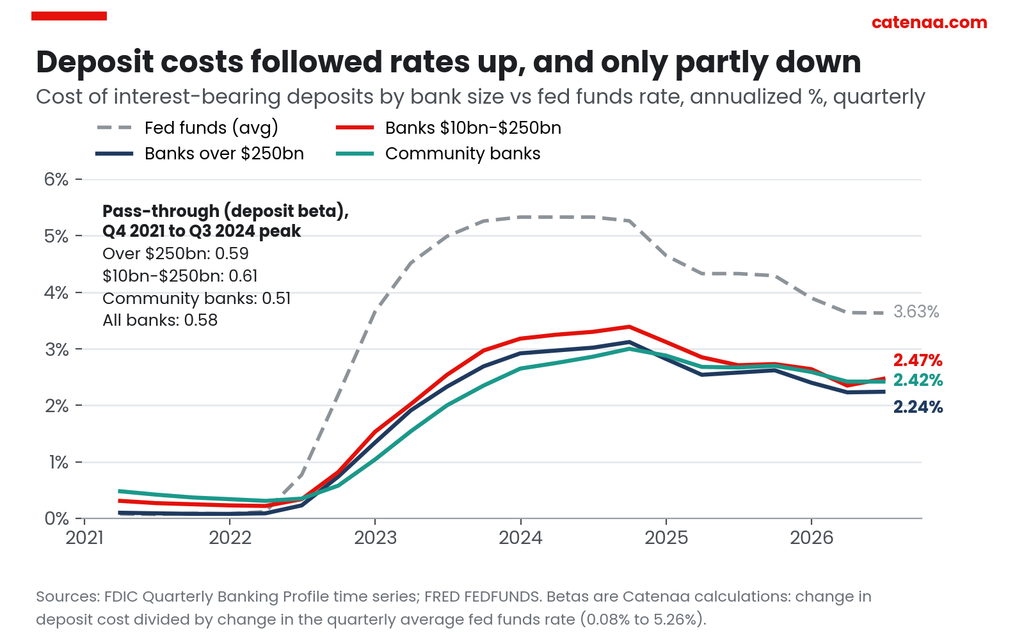
Since then, costs have fallen, but only by about half as much as the policy rate. The cost of interest-bearing deposits peaked at 3.19% in Q3 2024 and stood at 2.32% in Q2 2026. In fact, deposit costs rose slightly in Q2, from 2.29%, even before the hike. Research from the St. Louis Fed also found that pass-through kept rising well after the last hike in 2023.
There is some good news. Deposits are growing. The Fed’s H.8 release shows deposits of $19.81 trillion in the week to 14 October, up 7.6% in a year. That growth rate is a Catenaa calculation, comparing the week with the September 2025 monthly average. That outpaces growth in bank credit, so there is no sign of deposit flight. Savers, though, still earn very little: the FDIC national average savings rate was 0.38% in September. Plentiful deposits give banks less reason to raise rates for savers. Even so, pass-through was highest at midsize banks of $10bn to $250bn. That points to more funding pressure on regional lenders. They also paid 2.47% for interest-bearing deposits in Q2, against 2.24% at banks above $250bn and 2.08% at the smallest. A Fed note also found that betas were more dispersed across banks in the last cycle.
Unrealized losses: why higher bond yields hurt banks
Rising long-term yields create a second problem for the US banking sector outlook. Banks hold large portfolios of bonds bought when rates were low. When yields rise, those bonds lose market value. At the end of Q2 2026, unrealized losses on securities totaled $326.7bn, or 5.5% of their cost. That is down from a peak of $688.2bn in Q3 2022, yet still large.
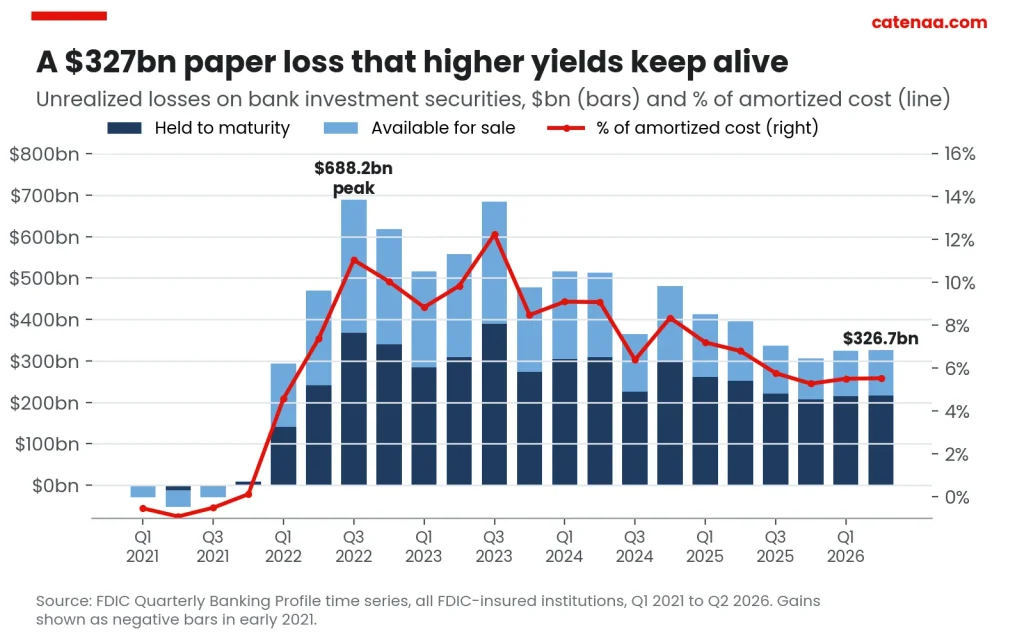
Most of the loss sits in held-to-maturity portfolios, at $216.9bn, or 10.5% of cost. Accounting rules keep these losses out of earnings and capital. The condition is that the bank intends, and is able, to hold the bonds to maturity. Nevertheless, the Fed’s May 2026 Financial Stability Report flagged the risk. It said fair value losses on fixed-rate assets were “still sizable and sensitive to changes in long-term interest rates”.
Timing matters here. The 10-year yield ended Q2 at 4.44% and Q3 at 5.29%, having crossed 5% only in mid-September. Banks mark these portfolios at quarter end, so third-quarter figures will probably show larger losses than Q2. The FDIC has not yet published that data. It gives no calendar date, but says the profile appears about 55 days after quarter end, so late November. A pending proposal adds to the stakes. One of three capital proposals from March 2026 covers bank capital treatment. After a transition, certain large banks would have to reflect unrealized gains and losses on certain securities in regulatory capital. The release does not say which securities, so the detail waits on the rule text.
Credit quality: cards cooling, CRE still the weak spot
Higher rates also test borrowers, which puts credit quality at the center of the US banking sector outlook. Here, the data send a mixed message. According to Federal Reserve data on FRED, card charge-offs at commercial banks held at 3.82% in Q2 2026. That is close to the pre-pandemic level of 3.78% in late 2019. They had peaked at 4.69% in Q3 2024. Card delinquencies also eased, to 2.85%. One portfolio sits higher than a year ago, though. Home loan delinquencies reached 1.86%, against 1.78% in Q2 2025. They had eased from 1.88% in the first quarter.
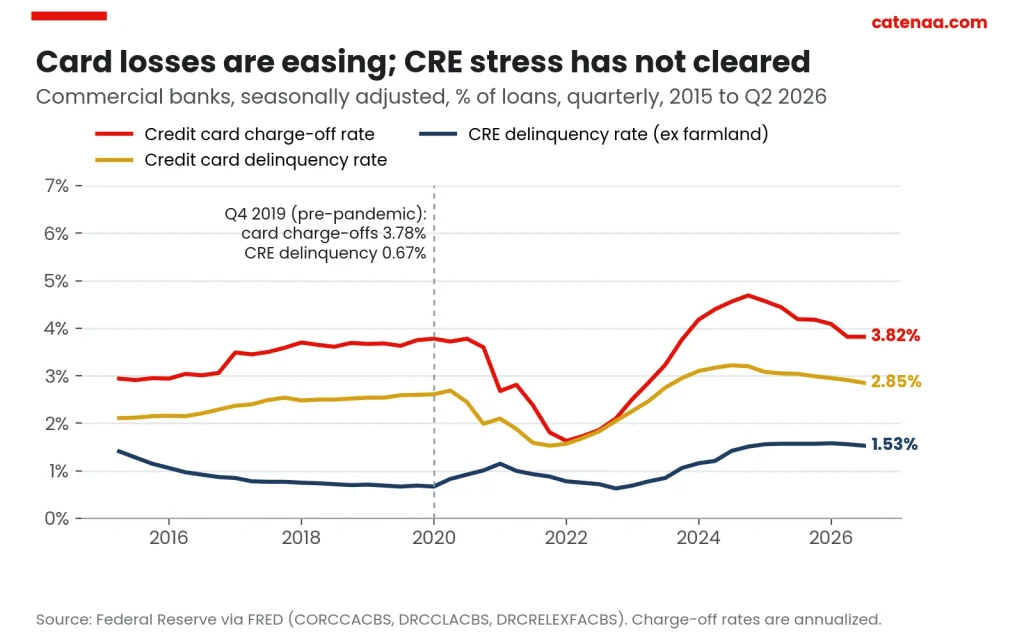
Commercial real estate (CRE) is a different story. The CRE delinquency rate at commercial banks counts loans 30 days or more overdue as well as those on nonaccrual. It stood at 1.53% in Q2 2026. That is more than double its 0.67% level in late 2019. FDIC data apply a stricter test, counting only loans 90 days overdue or on nonaccrual. On that basis the rate for nonfarm, nonresidential property was 1.23% across all insured institutions. At banks above $250bn it reached 2.24%. Meanwhile, the Fed’s stress scenario assumed a 39% fall in CRE prices. Even so, all 32 tested banks stayed above their minimum capital requirements.
Lenders are sending mixed signals. In the Fed’s July 2026 Senior Loan Officer Opinion Survey, a net 6.7% of banks tightened standards on credit cards. By contrast, a net 11.3% eased standards on nonfarm, nonresidential CRE loans. For every category except business loans, standards remain at the tighter end of their range since 2005.
Third-quarter filings point the same way for the US banking sector outlook. Bank of America reported a sixth consecutive quarter of year-on-year improvement in card delinquencies. Wells Fargo released reserves against commercial property loans, while building them for business and auto lending. Three of the four banks still added to total reserves, so caution has not vanished.
Households tell a more uneven story. The Fed’s 2025 Survey of Consumer Finances arrived on 9 October. It shows the share of families with debt payments above 40% of income rising from 6.5% to 8.6%. That is the highest reading since 2013. The G.19 consumer credit release also shows revolving credit contracting at a 4.2% annual rate in August.
Meanwhile the fastest-growing large loan category sits elsewhere. H.8 data show lending to nondepository financial institutions at $2.11trn in mid-October. That is up 22.3% in a year, on the same calculation. That book is now larger than the entire credit card book of $1.11trn. These loans fund private credit funds, mortgage companies and similar intermediaries. Bank disclosures describe those risks only in part.
Winners and losers in the US banking sector
Across the US banking sector, the outlook differs sharply by bank size. Size shapes both earning power and risk. Smaller banks earn wider margins. In Q2 2026, banks with $100m to $1bn in assets posted a margin of 4.02%. Banks above $250bn posted 2.94%. Community banks also gained. On the FDIC’s community-bank measure, their margin rose 19 basis points on the year to 3.81%.
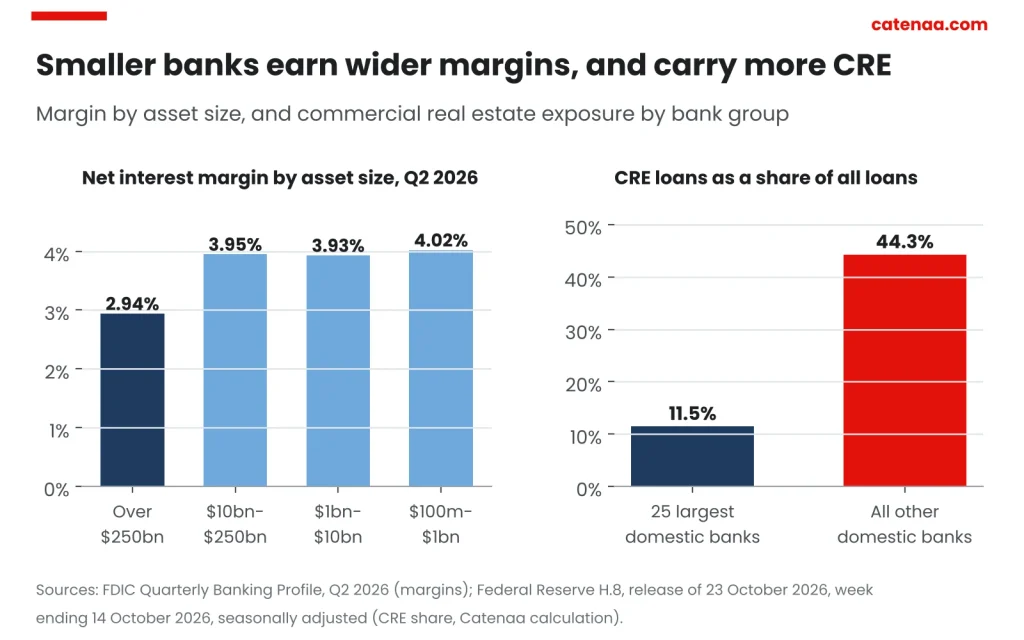
However, small banks also carry more property risk. H.8 data for the week to 14 October show the gap. CRE made up about 44% of loans at domestic banks outside the 25 largest, which the Fed calls “small”. At the 25 largest domestic banks, the figure was about 11.5%. The smaller group also holds 67% of all commercial banks’ CRE loans, and close to 70% of the domestic total. As a result, a rise in rates that squeezes property owners would weigh most on regional and community lenders. Losses so far tell a more mixed story, though. The largest banks report the highest noncurrent rate on nonfarm, nonresidential property loans, at 2.24%.
Large banks, meanwhile, have more levers. JPMorgan and Citigroup grew revenue on trading and fees as well as lending. Bank of America and Wells Fargo leaned on net interest income instead, because trading and banking fees fell at both. Capital ratios tell a subtler story. All four reported a lower common equity tier 1 ratio than a year earlier, on the figures in their quarterly supplements. Wells Fargo’s fell from 11.0% to 10.0% and Bank of America’s from 11.6% to 10.9%. JPMorgan’s slipped from 14.8% to 13.9%, and Citigroup’s from 13.3% to 12.8%. Buybacks and dividends explain part of that. Balance-sheet growth explains the rest, because JPMorgan’s risk-weighted assets rose 13% over the year, faster than its core capital.
Regulation: lighter rules, heavier penalties
Rules have loosened at the margin. On 30 September the Fed finalised two stress-test rules. From 2028, each bank’s stress capital buffer will be set on the average of its two most recent tests. The Fed expects that to cut year-on-year swings in requirements by about half. A final leverage ratio rule took effect on 1 April 2026 for the largest banks. The community bank leverage ratio then fell from 9% to 8% on 1 July 2026. Meanwhile the three capital proposals issued in March 2026 remain proposals.
Enforcement, the other half of the US banking sector outlook, has turned severe. On 13 October the OCC assessed a $750m civil money penalty against Bank of America for Bank Secrecy Act violations. It called the sum “the largest in OCC history”. The Financial Crimes Enforcement Network added $1.2bn, and the Treasury’s sanctions office settled for $11.6m. Bank of America booked a $1.2bn charge for the quarter, worth $0.17 a share. Reported earnings per share came in at $0.91, against an adjusted $1.08. Its filing does not say how much of the penalties it had already provided for. Five days earlier, the OCC had assessed a $350m penalty against American Express National Bank. The date was 8 October, and the failures were similar. It listed both actions in its monthly enforcement summary on 22 October. Separately it published a review of account-closure practices at the nine largest national banks.
US banking sector outlook: four scenarios to watch
Putting it together, the US banking sector outlook after the Fed hike turns on four scenarios.
- Base case: a modest margin lift. Suppose deposit growth stays strong and banks pass on less than half of the hike, as they did last cycle. Then margins could edge higher into 2027. Earnings would benefit, though the gains would likely amount to basis points, not percentage points.
- Risk case: the curve keeps flattening. The gap between 2-year and 10-year yields has narrowed to 0.31 points. A flatter curve trims the spread on new lending, even while the policy rate rises.
- Credit case: CRE refinancing bites. The Fed’s Financial Stability Report notes a large volume of CRE debt still needs refinancing. Higher rates raise the risk that some borrowers cannot roll over loans, especially at smaller banks.
- Shadow-lending case: the new exposure bites. Loans to nondepository financial institutions have grown 22.3% in a year. A stumble in private credit would reach banks through this channel first.
Four events will shape the rest of the year. The Fed decides on 28 October, without new projections. Third-quarter growth and the September PCE inflation reading both land on 29 October, the day after. The October jobs report follows on 6 November. The FDIC’s third-quarter industry figures should arrive around late November, and the Fed decides again on 9 December.
Overall, the US banking sector outlook rests on solid foundations. Profits are strong, card losses are falling, and deposits keep growing. Therefore, further tightening is more likely to test banks than to break them. Still, the pressure points have shifted. Watch funding costs at the regionals, the flatter curve, and lending to nonbank financial firms.
Frequently asked questions
How does the Fed rate hike affect US banks?
A higher policy rate lifts yields on loans and bonds, which can widen net interest margins. Third-quarter results showed that effect, with net interest income up 5% to 14% at the four largest US banks. At the same time, higher rates raise deposit costs and unrealized bond losses, and they squeeze weaker borrowers.
Will the Fed raise rates again in 2026?
The minutes of the September meeting, published on 7 October 2026, say most participants expect another increase by year end. September inflation data then came in hot, with consumer prices up 3.7% over the year. The next decision is due on 28 October, and the following one on 9 December.
Which banks benefit most from higher rates?
Banks with low deposit costs and many floating-rate loans usually gain most. Smaller banks earn wider margins, but they carry much more commercial real estate exposure. That makes the US banking sector outlook more mixed for regional and community lenders.