

The global bond market has entered a new era, and 2026 makes that shift impossible to ignore. This market, worth roughly $143 trillion to $156 trillion, is the largest on Earth and several times the size of the global stock market. For four decades, falling interest rates made bonds a quiet, reliable anchor. That era is over. Today, three forces dominate the landscape: record government borrowing, supply-shock inflation, and a changing base of investors. Together, they have brought income back to bonds, yet also introduced volatility. This analysis explains how the global bond market works, why it changed, and where it goes next.
In Summary
The global bond market is worth about $143 trillion to $156 trillion, far larger than the global equity market, per SIFMA and BIS data.
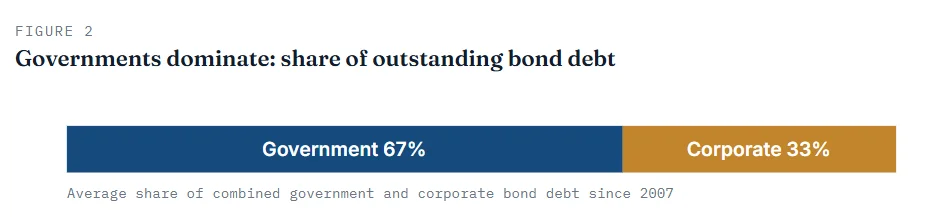
Governments issue roughly 67% of all bonds. Consequently, rising sovereign debt now drives long-term yields.
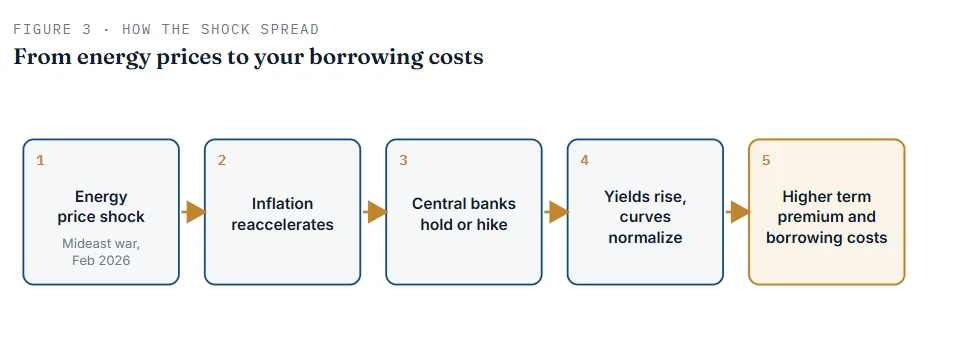
A 2026 energy shock revived inflation. As a result, central banks moved from cutting rates to holding or hiking.
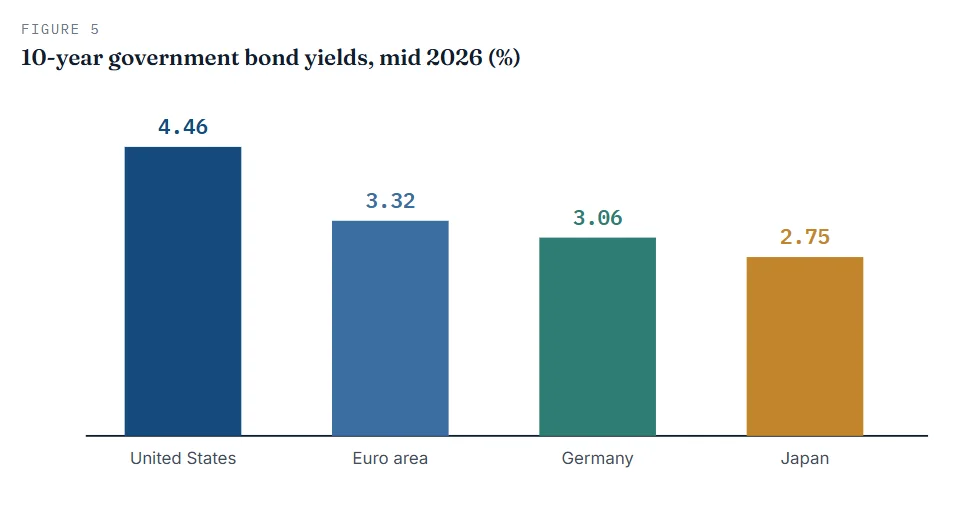
Benchmark yields rose. The US 10-year Treasury sits near 4.46%, and yield curves slope upward again.
A structural handover is underway. Central banks are stepping back, so more price-sensitive investors now set prices.
Diversification is harder. When inflation jumps, stocks and bonds can fall together.
The outlook splits three ways: disinflation relief, higher-for-longer rates, or entrenched stagflation.
What the global bond market is, and why it dwarfs stocks
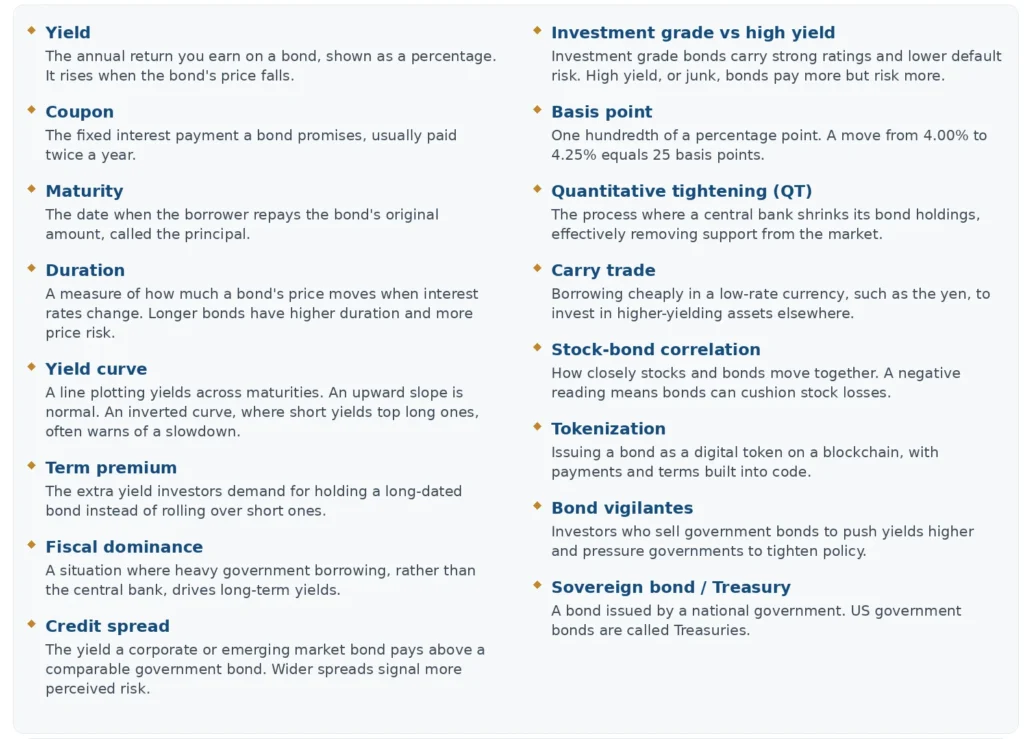
A bond is simply a loan that you can buy and sell. When a government or company needs money, it borrows from investors by issuing a bond. In return, the borrower promises two things. First, it pays regular interest, called the coupon. Second, it repays the original sum, the principal, on a set date called the maturity date.
The scale here is staggering. Global fixed income outstanding reached $145.1 trillion in 2024, according to SIFMA. Separate estimates from Bloomberg and the BIS put the figure above $156 trillion as of August 2025. Either way, the credit market runs about three times the size of the global equity market. In short, bonds are where the world does its serious borrowing.
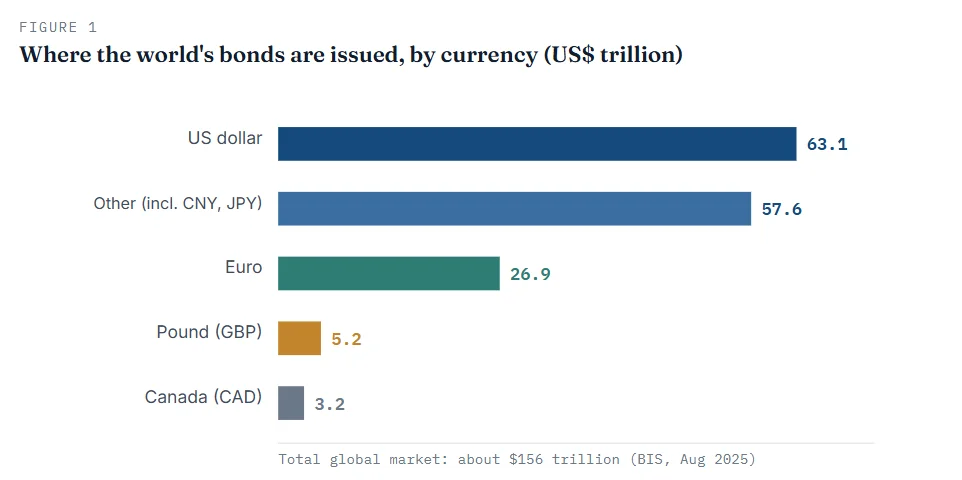
Two features define the market’s shape. Governments dominate issuance, and the US dollar dominates currency. The chart below shows how the world’s bonds are split by currency of issue.
The market also splits by who borrows. Governments are the giants. On average, since 2007, government bonds have made up about 67% of combined bond debt, with companies issuing the rest. This balance matters for a simple reason. Because governments borrow so heavily, their fiscal choices now steer the entire market. The next figure makes the split clear.
How bond prices and yields move: the one rule to remember
Here is the idea that unlocks everything else. Bond prices and bond yields move in opposite directions. When one rises, the other falls. This inverse link confuses many beginners, so let us walk through it slowly.
Imagine you buy a bond that pays a fixed 4% coupon. Now suppose new bonds begin paying 5%. Your 4% bond looks less attractive. Therefore, its price must fall until its effective return, the yield, matches the new 5% level. The coupon never changes, but the price does. Consequently, the yield rises as the price drops.
The reverse also holds. When market interest rates fall, older higher-coupon bonds become more valuable. Their prices rise, and their yields fall. This is why bond investors watch central banks so closely. Rate expectations move prices every single day.
One more term matters here: duration. Duration measures how sensitive a bond’s price is to changes in interest rates. Longer-dated bonds carry higher duration. As a result, a 30-year bond swings far more in price than a 2-year bond when yields move. Students should remember this trade-off. Longer bonds usually pay more, yet they also carry more price risk.
The 2026 pivot: an energy shock resets the outlook
Investors began 2026 expecting calm. Inflation was cooling, and many forecasters penciled in more rate cuts. Then the picture changed fast. A war in the Middle East began in late February 2026. Oil prices jumped, and inflation reaccelerated.
The effect showed up quickly in the data. Core PCE inflation, the gauge the Federal Reserve watches most, rose from 3.0% in December 2025 to 3.3% by April 2026. Higher energy costs then rippled into transport, production, and consumer prices. Meanwhile, the earlier hope for smooth disinflation faded. The diagram below traces how a single supply shock reshaped the whole bond market.
Central bank policy and bond yields in 2026
Central banks steer short-term rates, and those decisions echo across the bond market. In 2026, the big three central banks each faced the same enemy: sticky inflation. However, they started from very different places.
The Federal Reserve holds a firm line
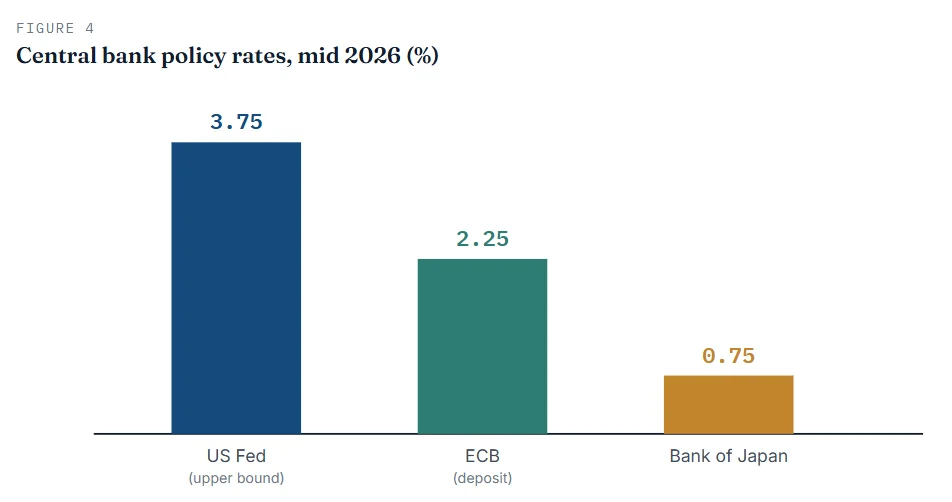
The Fed cut rates three times in late 2025. Since then, it has paused. At its June 2026 meeting, the Federal Open Market Committee kept the target range at 3.50% to 3.75%. Notably, its projections shifted from expected cuts toward possible hikes, as new Chair Kevin Warsh stressed price stability, per reporting on the June dot plot. Long-term yields responded. The US 10-year Treasury trades near 4.46%, while the 2-year sits around 4.07%.
The ECB turns hawkish on energy
Europe faced the sharpest inflation surprise. In June 2026, the European Central Bank raised its three key rates by 25 basis points. The deposit rate climbed to 2.25%. The ECB warned that war had lifted energy prices and inflation risks. As a result, 10-year yields in the euro area rose toward 3.3%. One structural point matters here. The ECB targets only inflation, so it leans hawkish faster than the Fed, which also weighs employment.
The Bank of Japan keeps normalizing
Japan tells a different story. After years near zero, the Bank of Japan raised its policy rate to 0.75% in December 2025, the highest level since 1995. Inflation there has run above target for years. Consequently, the 10-year Japanese government bond yield pushed above 2.7%, and the 30-year reached about 4.0%. Both stand near multi-decade highs. This shift carries global weight, a point we return to below.
The next two charts compare policy rates and long-term yields across these major economies.
Global bond market trends reshaping fixed income
Cyclical news grabs headlines, but structural trends decide the future. Four shifts now redraw the global bond market. Each one runs deeper than any single rate decision.
Trend 1: fiscal dominance and the return of the term premium
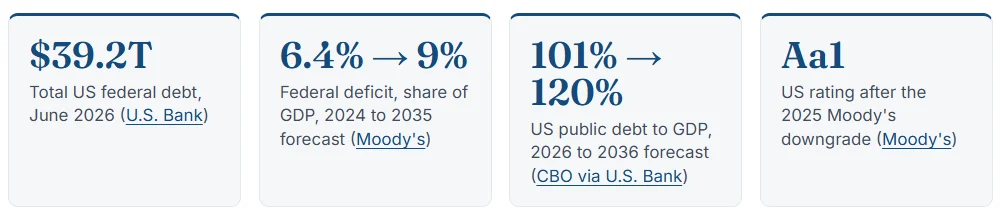
Government supply now shapes yields as much as central banks do. The United States sits at the center of this story. Total federal debt reached $39.2 trillion in June 2026, and annual deficits run near $2 trillion. In May 2025, Moody’s stripped the country of its last top rating and cut it to Aa1. That move left all three major agencies ranking US debt below the top tier.
These strains show up in the term premium. This is the extra yield investors demand to hold long bonds rather than short ones. It turned positive again, adding roughly 75 basis points to the 10-year yield. In plain terms, buyers now charge governments more for long-term trust. Analysts call this dynamic fiscal dominance, where debt, not the central bank, sets the tone at the long end.
Trend 2: the great investor-base handover
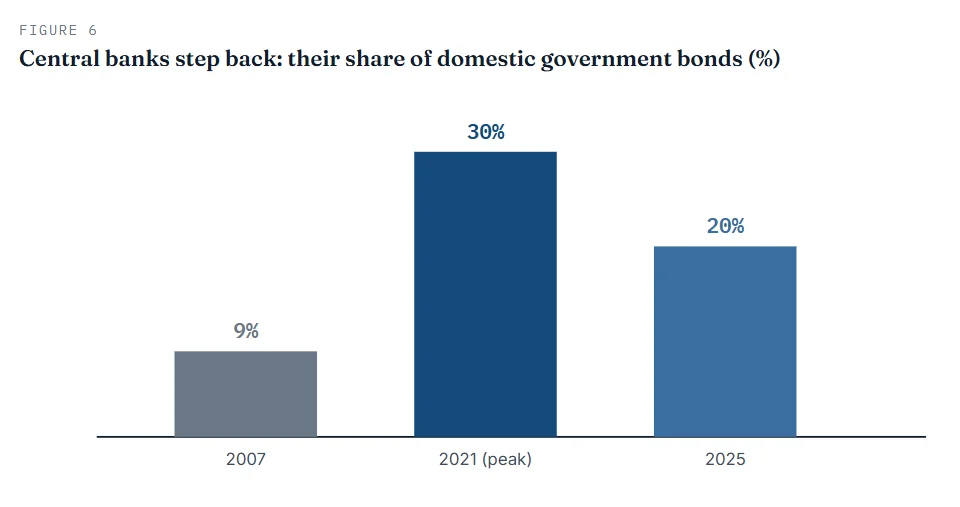
For years, central banks bought bonds in bulk through quantitative easing. Those buyers barely cared about price. Now they are retreating. After three years of quantitative tightening, central banks held about 20% of domestic government bonds in 2025. That share peaked near 30% in 2021 and stood at just 9% in 2007.
Someone must replace those buyers. Increasingly, that means foreign investors, funds, exchange-traded funds, and hedge funds. These buyers are far more price-sensitive. Therefore, yields now react more quickly to supply and shifting sentiment. The OECD warns of surface-level calm while new risks build beneath it. In practice, this handover raises the odds of sharp, sudden moves. Figure 6 shows the retreat of the once-dominant central bank buyer.
Trend 3: the AI supply wave and the refinancing wall
Companies also borrow in the bond market. Two pressures now drive corporate supply higher. First comes artificial intelligence. Building data centers costs enormous sums. The OECD estimates that nine hyperscalers plan about $4.1 trillion of capital spending between 2026 and 2030. Morgan Stanley sees an AI financing gap of up to $1.5 trillion through 2028, with roughly 77% funded by debt. Figure 7 puts that ambition in context.
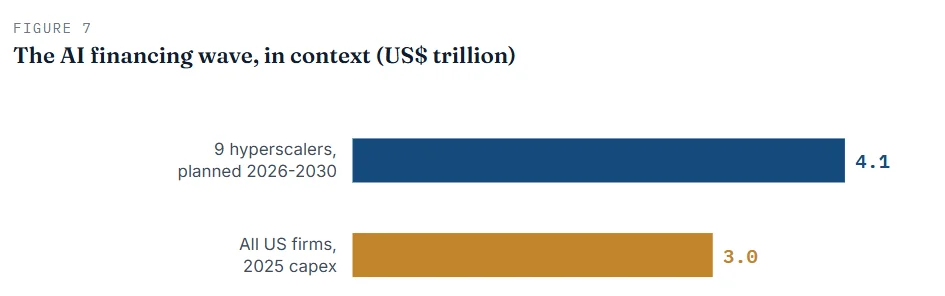
The second pressure is a wall of maturing debt. Companies must refinance old bonds as they come due. Over the next three years, refinancing covers 24% of investment grade and 31% of junk-rated debt. Crucially, most of that debt is cheap. About 65% of investment-grade bonds due between 2026 and 2028 carry a coupon of 4% or less. Refinancing at today’s higher rates will therefore lift interest bills. In the US, high-yield alone, more than $700 billion falls due across 2027 to 2029.
Put these together, and the message is clear. Bond supply is heavy, structural, and largely non-discretionary. Analysts expect record high-grade issuance near $1.8 trillion or more in 2026. More bonds can mean wider spreads over time.
Trend 4: Tokenization rewires the plumbing
The bond market has been slow to modernize. It still relies on manual processing and long settlement chains. Tokenization aims to change that. It records bonds as digital tokens on a blockchain, with coupons and maturities built into code. The pace of real-world pilots picked up sharply. In January 2026, the ECB paved the way for the acceptance of blockchain-based assets as collateral. Meanwhile, the Bank of Canada, HSBC, and several European banks completed live digital bond deals.
The prize is efficiency. Tokenization can shorten settlement, cut costs, and open bonds to smaller investors through fractional units. McKinsey estimates tokenized bonds could exceed $1 trillion in outstandings by 2030. Still, the technology remains young. Secondary trading is thin, and legal rules differ by country. For now, treat tokenization as a slow, powerful tailwind rather than an overnight revolution.
What the new regime means: implications for you
Trends matter only when we translate them into consequences. This new regime touches investors, governments, and the wider financial system. Let us take each in turn.
For investors: the end of easy diversification
For two decades, bonds hedged stocks. When shares fell, bonds usually rose, cushioning the blow. That relationship broke in 2022. Inflation surged, both assets fell together, and the classic 60/40 portfolio dropped about 17% in its worst year since 1937. The stock-bond correlation then normalized, sliding from 0.80 in mid-2024 to just 0.16 by late 2025. However, the 2026 inflation shock risks pushing it positive once more. Figure 8 tells that story.
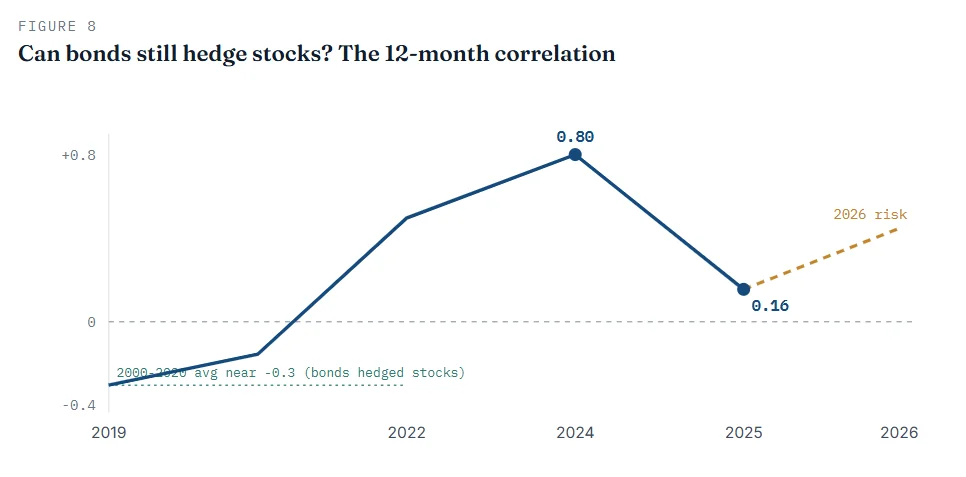
What should investors take from this? The good news is real. Yields are high again, so bonds now pay you to wait. That income cushions returns and rewards patience. The caution is equally real. When inflation drives markets, bonds hedge stocks less well. As AQR notes, adding more equities is a poor answer to that problem. A better response is broader diversification, quality issuers, and sensible duration.
For governments: higher-for-longer debt service
Rising yields punish borrowers with heavy debt. As cheap bonds mature, governments must refinance at higher rates. US interest costs already topped $1 trillion a year. Furthermore, Moody’s expects interest to consume nearly 30% of federal revenue by 2035. Higher interest bills crowd out other spending. They also shrink the room for stimulus in the next downturn. In the worst case, a feedback loop forms in which higher debt lifts yields, which then raise debt still further.
For financial stability: watch the fault lines
Three quieter risks deserve attention. First, Japan matters more than its yields suggest. Japanese pensions and insurers own vast foreign bond holdings. As domestic yields rise, some of that money may return home. In turn, that pull can lift yields in the United States and Europe, as analysts warn. Second, private credit shows early cracks. A few high-profile defaults have unsettled investors and widened the gap between winners and losers. Third, spreads sit near record lows, so any shock lands on a thin cushion.
Emerging market debt in 2026: a relatively bright spot
Emerging markets round out the global picture, and they enter 2026 in surprising strength. This segment reached about $41 trillion in aggregate, with China alone near $21 trillion. Returns were strong last year. Local-currency bonds gained 19.3% in dollar terms, while dollar investment-grade sovereigns rose about 10%.
Fundamentals also look sturdier than many assume. Emerging market companies often carry less leverage than their US peers. In fact, the emerging-market hard-currency corporate market, at nearly $2.5 trillion, is almost twice the size of the US high-yield market. Yet valuations flash a warning. Sovereign spreads sit at their tightest since October 2007. That leaves little room for error. Once again, careful selection beats broad exposure.
Bond market outlook: three scenarios to 2027
No one can predict yields with certainty. Even so, we can map the road ahead. The path now hinges on one question: does inflation fade or entrench? The three scenarios below frame the likely outcomes. Each carries a different lesson for bondholders.
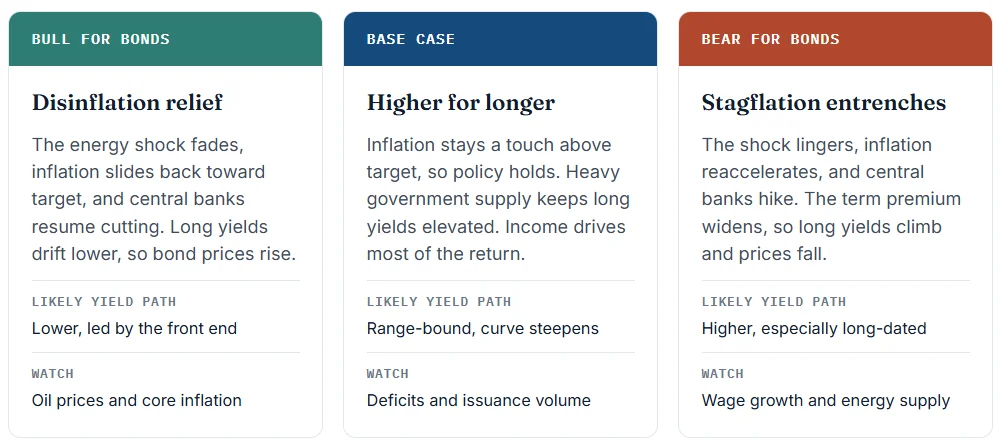
Beyond these near-term paths, several structural forces look durable. Heavy government supply should keep long yields elevated for years, even if policy rates fall. Tokenization should gradually scale and modernize the way bonds trade. Emerging markets should keep deepening their local-currency markets. The dollar, meanwhile, should stay dominant. Even Moody’s, in its downgrade, expects the dollar to remain the world’s reserve currency for the foreseeable future.
The bottom line for investors and students
Step back, and the argument comes into focus. The global bond market has left the low-rate era behind. Income has returned, which is a genuine gift after years of near-zero yields. Risk has returned too. Tight spreads, heavy supply, fiscal strain, and weaker diversification all demand respect.
The sensible response is focus, not flight. Prioritize quality issuers. Match your bond maturities to your time horizon. Above all, diversify across countries, sectors, and asset types. For students, the deeper lesson is simple. The bond market prices trust, time, and risk every second of every day. Learn to read it, and you will understand the world economy far better than most investors ever do.
Glossary