

The most significant market signal this week is not that yields are high. It is that the same pool of capital is being asked to fund governments, AI infrastructure and increasingly financialized digital resources all at once. And that changes what traders need to look for in the next move for bitcoin, tech stocks, and the dollar.
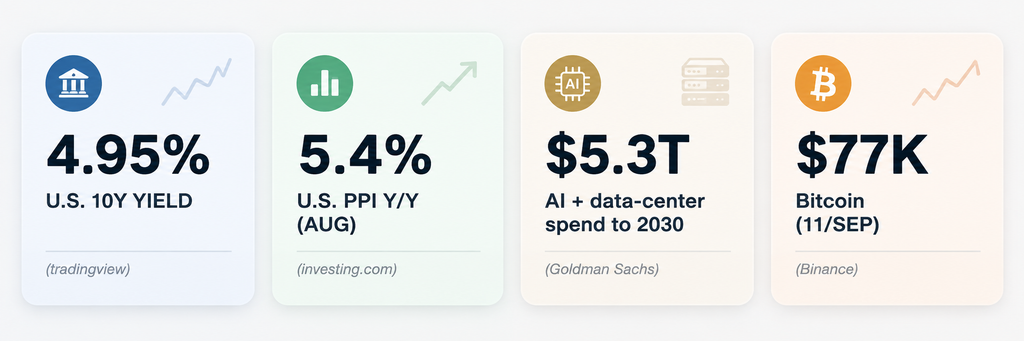
The market regime is changing behind the headlines. August CPI was 3.4% year over year, while August PPI stood at 5.4%.1. The U.S. 10-year Treasury yield rose to an intraday high of 4.9915% on September 11. An energy shock keeps alive the risks of inflation, with Brent crude holding above $100 and the European Central Bank (ECB) already hiking rates again. At the same time, hyperscalers are preparing to invest around $5.3 trillion in AI and data-center spending by 2030, an amount of investment large enough to directly compete with sovereign borrowers for long-duration capital2.
For an intermediate market reader, the key question is no longer simply “Is crypto bullish or bearish?” Which assets are most sensitive to the cost and availability of capital and which ones can still attract flows despite higher real financing costs?
| 5% treasury yield does not automatically kill the crypto or AI equities. But it sets a bar that any asset based on distant cash flows, abundant leverage or persistent liquidity has to cross. Bitcoin is no longer outside the cross-asset contest, but rather in it. |
The bond market is becoming the market’s first filter
The 10-year Treasury is often treated as background noise. It is more like a master discount rate in this regime. With the 10-year near 5%, investors have to reassess what they are willing to pay today for profits, growth and risk that will come years down the road.
What’s interesting about the current move is that it’s not being driven by one clean story. The Fed is grappling with still over target inflation, the ECB is tightening into an energy shock and governments are issuing large volumes of debt with private infrastructure borrowers expanding alongside. The Treasury itself raised the size of buybacks of longer dated paper to a minimum of $4 billion per operation starting Sept. 9, specifically to boost liquidity in longer maturities3.
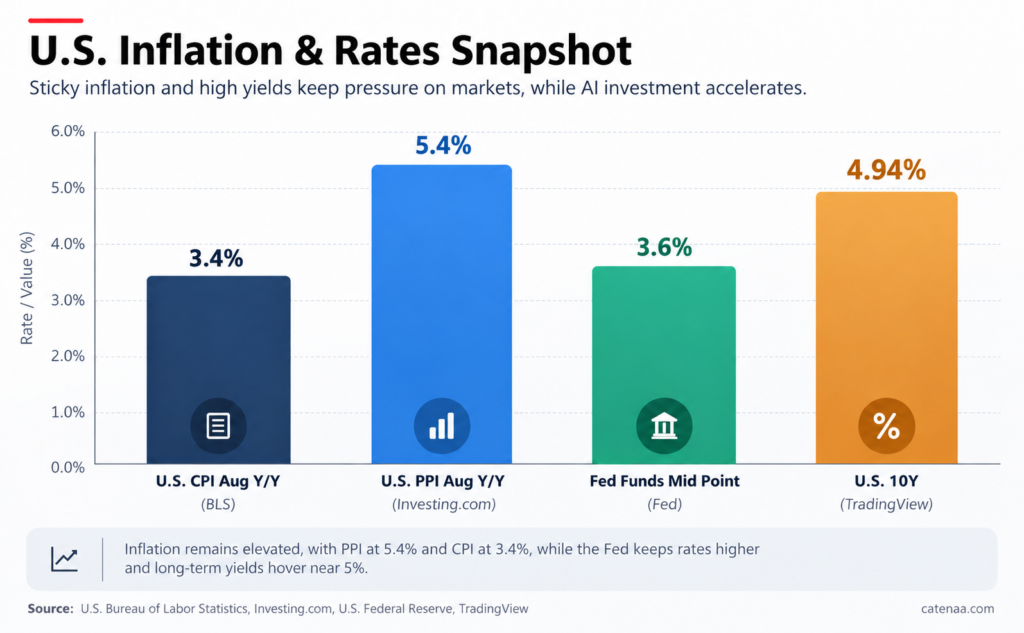
This is why simply saying “the Fed is hawkish” misses the point. Even with traders pricing in eventual policy easing, the term premium, fiscal supply and competition for duration can all swamp the front end of the curve, allowing the long end to remain under pressure.
The global yield shock is broader than the Fed
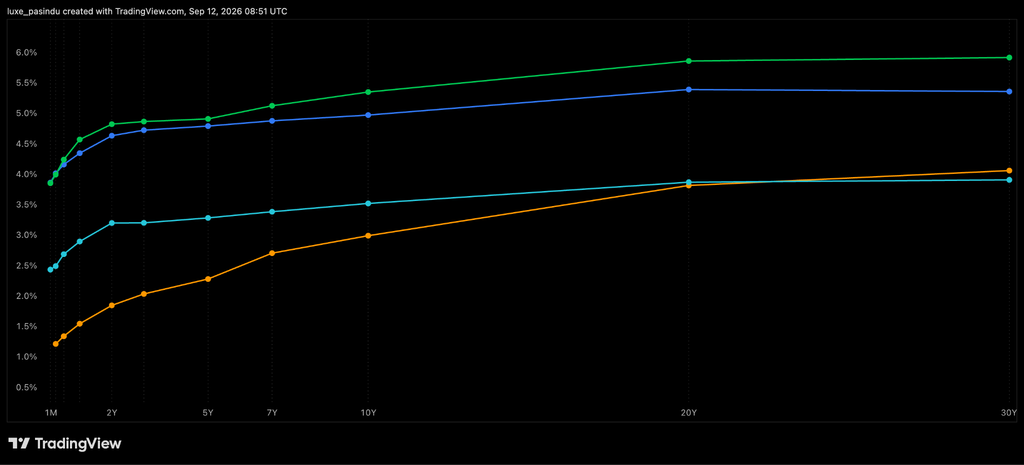
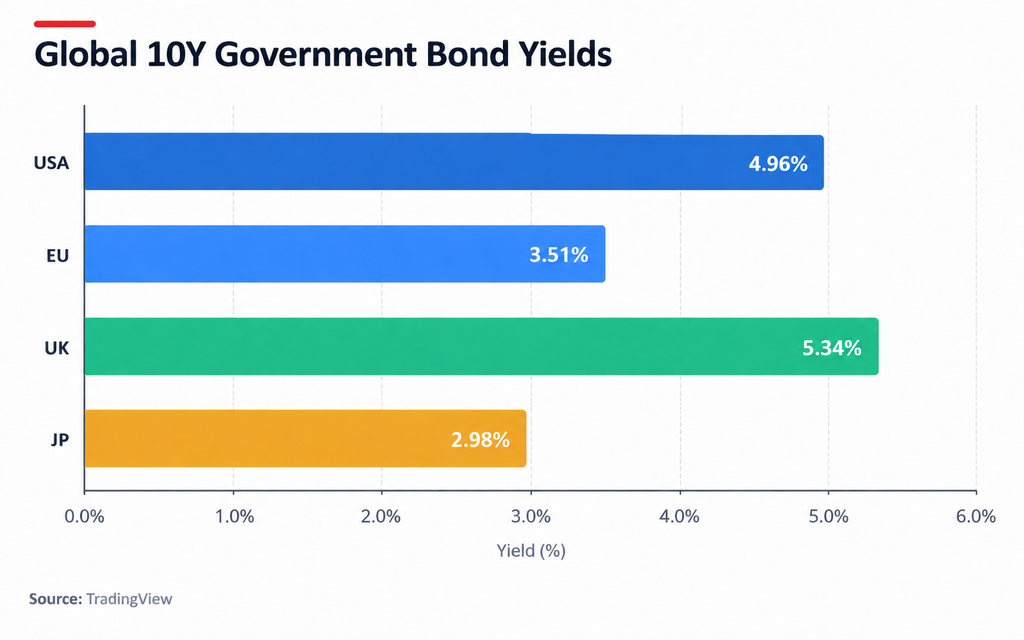
The graph above adds a useful dimension to the preceding 10-year comparison in that it illustrates not just that yields are high but that the structure of the repricing varies across countries. Long-end yields remain highest in the UK, with the curve climbing to around 5.347% in 10-year, 5.858% in 20 year and 5.914% in 30 year. The United States remains the second highest of the four.
Germany is behind the U.S. and U.K., but the curve is still obviously upward sloping, from around 2.430% at 1 month to 3.506% at 10-years and 3.895% at 30 years. Japan still has the lowest front end, but its long end is no longer low in absolute terms. The 10-year yield is about 2.987%, the 20 year at 3.812% and the 30 year around 4.057%.
| Country | 10Y | 20Y | 30Y | Interpretation |
| United Kingdom | 5.347% | 5.858% | 5.914% | Highest long end stress, steep and elevated duration pricing. |
| United States | 4.946% | 5.369% | 5.340% | Long end above 5% confirms persistent term premium and supply pressure. |
| Germany | 3.506% | 3.857% | 3.895% | More orderly than the U.S./U.K. but still clearly repriced upward. |
| Japan | 2.987% | 3.812% | 4.057% | Normalization continues, long end yields are high relative to Japan’s recent history. |
The practical conclusion is that “higher yields” is an oversimplification. The U.K. curve is most stressed at longer durations, the U.S. curve has a long end that remains expensive even without a clean re-acceleration in growth, Germany shows Europe is still participating in the repricing, and Japan shows how even a formerly ultra low rate market can amplify the global move when normalization kicks in. For cross-assets investors, these differences matter because the source and location of yield pressure can have different implications for equity valuations, currencies, credit spreads, and portfolio duration.
This is most important at the style level for equities. Established organizations with cash flows that are closer in time have less duration than high growth corporations whose earnings are in the long future. So an expanding discount rate provides a mechanical valuation headwind before earnings estimates even move.
Crypto is distinct structurally but comparable in sensitivity. Bitcoin, however, has no corporate cash flows to discount but its marginal buyer increasingly intersects with the same institutional capital that prices shares, credit, commodities and foreign exchange. It stresses cross-asset liquidity and real-rate conditions more than when bitcoin was a predominantly retail-driven niche.
The AI boom may be adding to the duration problem
One of the least appreciated correlations in this market is the capital expenditure cycle of AI and government bond yields. Goldman Sachs says hyperscalers may invest $5.3 trillion on AI and data centers by 2030. As those investment demands grow, the same study suggests, private market funding will become more significant4.
Oracle is an excellent live example. Revenue grew 30% YoY to around $19.3 billion in the company’s most recent quarter, with cloud infrastructure revenue growing 121% and capital expenditures of $28.5 billion. It has $664 billion of remaining performance obligations and expects to spend around $90 – 95 billion on capital expenditures in fiscal 20275.
The bullish scenario is demand for AI is so robust that it justifies outrageous spending on infrastructure. A less appetizing view is that the spending has to be absorbed by the financial system, combined with a significant issuance of sovereign debt. Even if central banks are not tightening forcefully, competition can keep the price of long term capital high.
| Why this matters for crypto? When AI capex, Treasury issuance and private credit all compete for long-duration capital, crypto needs a stronger marginal demand story to outperform. “Liquidity is rising” is no longer enough as a thesis unless the liquidity is actually reaching risk assets. |
Oil is no longer just an inflation headline
Brent crude averaged relatively above $90 in August, but has increased to over $98.75 a barrel so far in September, including a session Friday in which it slightly exceeded $106 before retreating. Tensions in the Middle East spiked as Reuters reported an intraday high near $109.976.
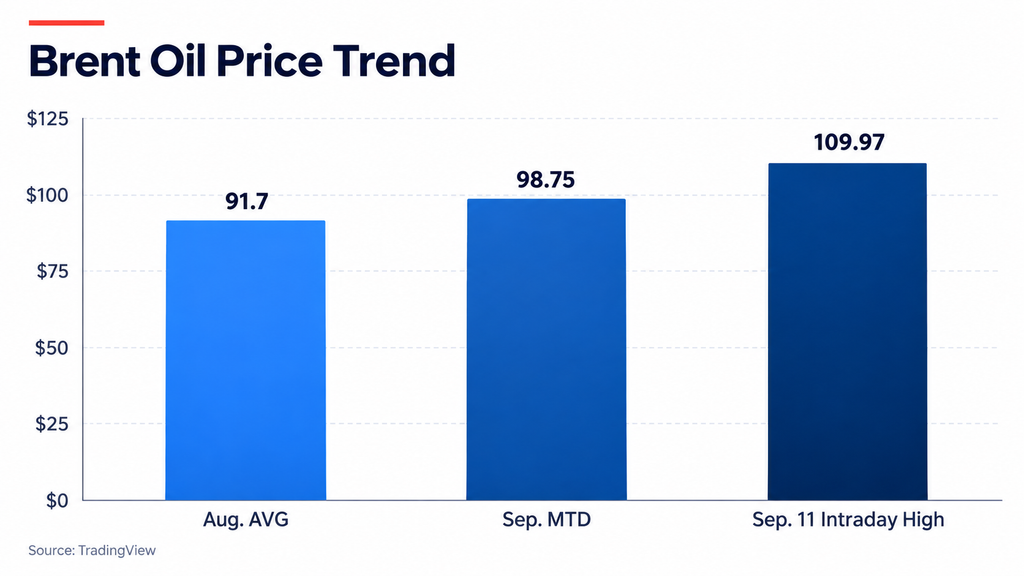
The reason oil is so important now is its second round effect. Higher crude prices boost transportation, output and inflation predictions. Higher rates won’t suddenly generate additional oil, but central banks may still tighten financial conditions to keep the shock from feeding into wages and services.
That makes for a difficult set up for risk assets. oil can boost prices at the same time that weaker growth becomes more likely. This is more a stagflationary shock than a traditional increase in demand.
Bitcoin is being pulled back into the macro machine
Bitcoin began September with a far more normal cross-asset profile than the previous “alternative monetary asset” story would suggest. According to CoinGecko, BTC’s daily data shows the price went from around $77.4k on September 1 to $81.3k on September 3, before falling down to around $78.5k on September 8. Bitcoin traded around $77,000 on September 1 and has a CoinMarketCap market valuation of about $1.55 trillion78.
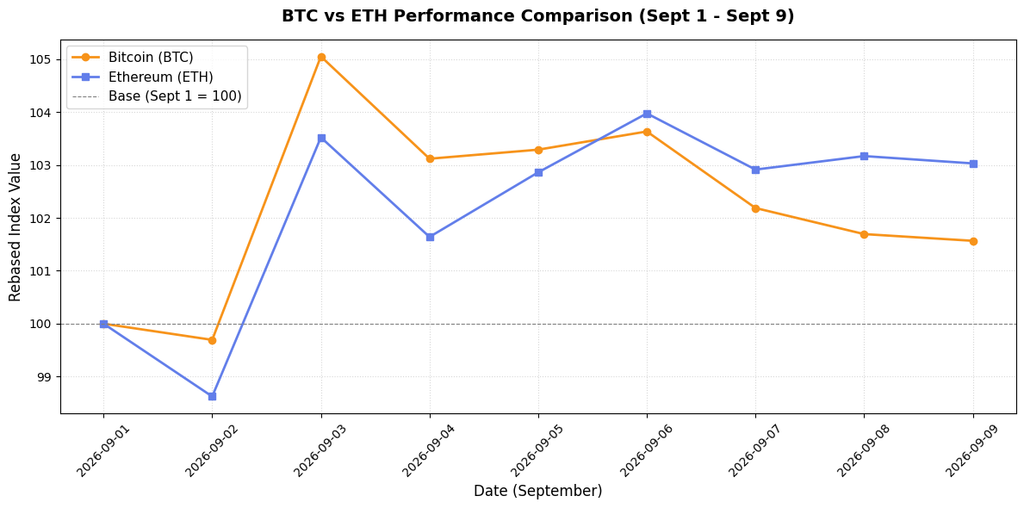
That’s a more practical way to think about it than asking if Bitcoin “acts like gold.” Gold is being driven by a combination of real rates, the currency, central bank demand and geopolitical hedging. Bitcoin is becoming another layer. It is also a high liquidity risk asset with a significant institutional trading footprint.
That is, Bitcoin can act like a monetary hedge over a multi-year horizon, but it can also act like a macro sensitive risk asset over a one day or one week horizon. Those two observations don’t contradict each other.
Hyperscalers are the bridge between AI and the bond market
To understand why the AI boom really does matter for macro investors, look underneath the applications and at the corporations actually buying the computer. Hyperscalers run computing infrastructure at massive scale global data center fleets, servers, networking gear, and specialized accelerators. The top U.S. names are Amazon, Microsoft, Google, Meta and Oracle. Apple also operates hyperscale infrastructure for its own services. Forbes said that top U.S. hyperscalers are forecast to spend more than $700 billion on AI computing in 20269.
This is a very concentrated market. Spending on cloud infrastructure services around the world was $143 billion during the second quarter of 2026, up 43 per cent over the same period last year, according to Synergy Research Group. The three giants AWS, Microsoft Azure and Google Cloud retained a combined 63% share, with AWS at around 28%, Microsoft Azure at 20% and Google Cloud at 15%10. It is not only about market share, a handful of corporations hold a very substantial share of the capital spending needed to construct AI infrastructure.
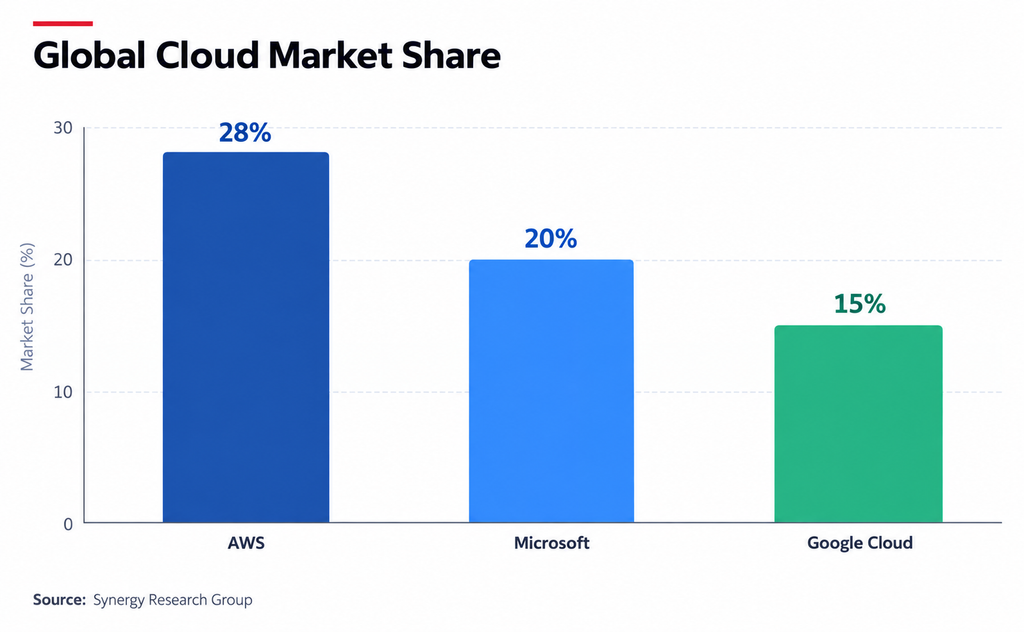
However hyperscalers are a bridge between the IT story and the bond market. Goldman Sachs believes that hyperscalers might spend $5.3 trillion on AI and data centers by 2030, with private market financing likely to become in importance as saturation and issuer concentration limits develop in liquid credit markets.
Oracle is a useful case study. In its most recent quarter, sales surged 30% year over year to $19.3 billion, cloud infrastructure revenue increased 121%, capital expenditure for the first quarter was $28.5 billion, and remaining performance obligations increased to $664 billion. Oracle also guided to about $90 – $95 billion of fiscal 2027 capital spending. Microsoft plans to expand data-center capacity to about 38 gigawatts by 2032, according to Bloomberg News, more than three times its current footprint.
The feedback loop is a key part. Strong AI demand supports additional infrastructure. That infrastructure requires chips, data centers and power Construction needs financing That financing creates competition for long-duration capital And if governments are issuing heavily too, the marginal investor has additional demands on the same pool of capital. That can sustain long-term yields at elevated levels even if central banks aren’t aggressively tightening.
The physical bottleneck is becoming part of the investment thesis
The AI infrastructure race is becoming an electrical and land race as well. Large data centers can demand hundreds of megawatts, and projects are increasingly competing for grid connections, transformers, land and cooling capacity. Google’s $15.1B commitment to Finnish AI infrastructure, three new data centers and a long term nuclear power deal with Fortum suggests hyperscalers are pushing upstream into energy sourcing11.
For investors, it expands the universe of opportunities beyond chips. The AI capital cycle involves utilities, nuclear power, grid equipment, transmission, cooling, data center operators and infrastructure funding. The downside is political and physical: availability of power, water consumption and permits can all become binding limits and delay projects or raise their cost.
| Market implication Treat hyperscaler capex as both an earnings signal and a duration signal. Strong AI demand can support technology stocks, while the financing required to satisfy that demand can simultaneously pressure long-term yields. That tension is one of the clearest links between the AI trade and the macro regime. |
The real trade is the interaction between rates, liquidity and regulation
| Theme | What is changing | What it means for traders |
| Rates | U.S. 10Y 4.946%U.K. 10Y 5.347%Germany 3.506%Japan 2.987% | Higher hurdle rate for long-duration and leveraged assets |
| Inflation | CPI 3.4%PPI 5.4%oil above $100 | Less room for central banks to ease aggressively |
| AI capex | Multi trillion dollar infrastructure buildout | Strong earnings narrative, but heavy capital demand |
| Crypto | BTC around $77k institutional market structure deeper | Macro sensitivity is increasing |
| Regulation | More explicit U.S. taxonomy and tailored exemptions | Potentially lowers some regulatory risk premia |
Three scenarios matter more than one forecast
Scenario A: Inflation stays hot and the 10-year breaks cleanly above 5%
The most difficult environment for assets with a long lifespan. Growth equities would see another valuation compression, the dollar may have further to go and Bitcoin would probably find it difficult to maintain upward momentum unless ETF or institutional demand was high enough to counteract the macro headwind. In this context, cash yields and shorter duration investments seem somewhat more attractive.
Scenario B: Inflation cools, but long yields remain high
This is the most interesting case. If CPI weakens but the 10-year is not moving much lower, the market is telling you that fiscal supply and term premium, not simply monetary policy, are moving rates. That might revive the difference between bond yields and the dollar that was seen earlier in September. Gold would have more room to rally, and Bitcoin might benefit if investors view the move as a confidence/fiscal repricing rather than a clean tightening shock.
Scenario C: Oil falls, yields retreat and liquidity broadens again
This is the clearest risk on setup. De-escalation in the Middle East would eliminate one of the main inflation threats. Lower energy prices would make it simpler for central banks to look through remaining price pressure and dropping long rates might restore the valuation support behind growth shares and crypto.
What intermediate traders should watch next
The highest value dashboard is not a list of twenty indicators. It is a small set of cross-asset relationships.
- First: watch the U.S. 10-years around the 5% threshold. A fast break is more important than a slow grind.
- Second: watch whether the dollar confirms the Treasury move. Higher yields plus a stronger dollar is the classic tightening signal, higher yields without dollar confirmation points to a more complicated fiscal/term premium regime.
- Third: watch BTC against Nasdaq and against real yields. If Bitcoin stops falling when real yields rise, that is a stronger structural signal than a single green daily candle.
- Fourth: watch ETF flows and stablecoin activity. Price is the outcome capital flows tell you whether institutional and crypto native demand are rebuilding underneath the volatility.
- Fifth: watch regulation as infrastructure. Clearer rules for asset classification, custody, issuance and stablecoins can change the investable universe even when macro conditions stay difficult.
- Bls.gov: https://www.bls.gov/news.release/archives/cpi_09112026.html ↩︎
- Goldmansachs.com: https://www.goldmansachs.com/insights/articles/private-markets-expected-to-have-growing-role-in-data-center-financing ↩︎
- Treasury.gov: https://home.treasury.gov/news/press-releases/sb0607 ↩︎
- Goldmansachs.com: https://www.goldmansachs.com/insights/articles/private-markets-expected-to-have-growing-role-in-data-center-financing ↩︎
- Oracle.com: https://investor.oracle.com/investor-news/news-details/2026/Oracle-Announces-Q1-Results-Driven-by-Triple-Digit-Growth-in-Cloud-Infrastructure-Revenues/default.aspx ↩︎
- Reuters.com: https://www.reuters.com/world/china/global-markets-corrected-2026-09-11/ ↩︎
- Coingecko.com: https://www.coingecko.com/en/coins/bitcoin/historical_data ↩︎
- Coinmarketcap.com: https://coinmarketcap.com/historical/20260911/ ↩︎
- Forbes.com: https://www.forbes.com/sites/technology/article/what-is-a-hyperscaler/ ↩︎
- Srgresearch.com: https://www.srgresearch.com/articles/q2-cloud-market-passes-143-billion-highest-growth-rate-in-eight-years ↩︎
- Reuters.com: https://www.reuters.com/business/media-telecom/google-invest-15-billion-ai-infrastructure-finland-2026-09-09/ ↩︎