


Three forces drained the bid. A fourth finished the job. The wreckage says more about how digital assets now trade than about whether they work.
In Summary
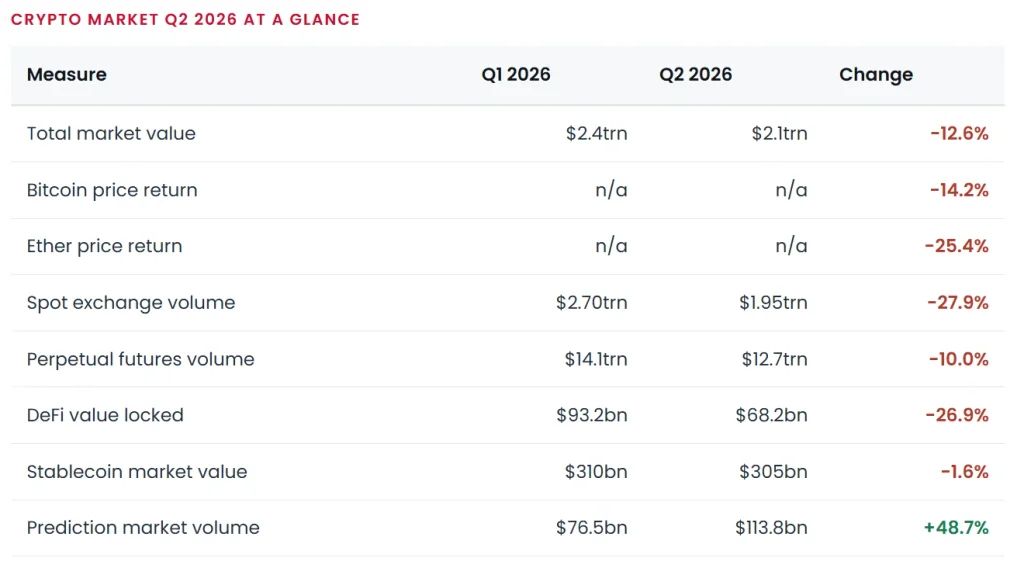
The crypto market’s Q2 2026 result was a third straight quarterly loss. Total market value fell 12.6% to roughly $2.1 trillion.
Bitcoin fell 14.2%, while Ether fell 25.4%. Furthermore, June alone caused most of the damage.
Spot bitcoin ETPs posted their worst quarter of outflows on record. That reversed the flow which had supported prices since 2024.
Strategy Inc bought 85,296 bitcoin at an average of $75,279, so it stayed a large net buyer. Even so, it sold coins for the first time to pay preferred dividends.
Meanwhile, stablecoin supply barely moved. The payment rails held while trading capital left, which sets this slump apart from 2022.
Prices have since bounced hard. Yet the lesson of the quarter still stands.

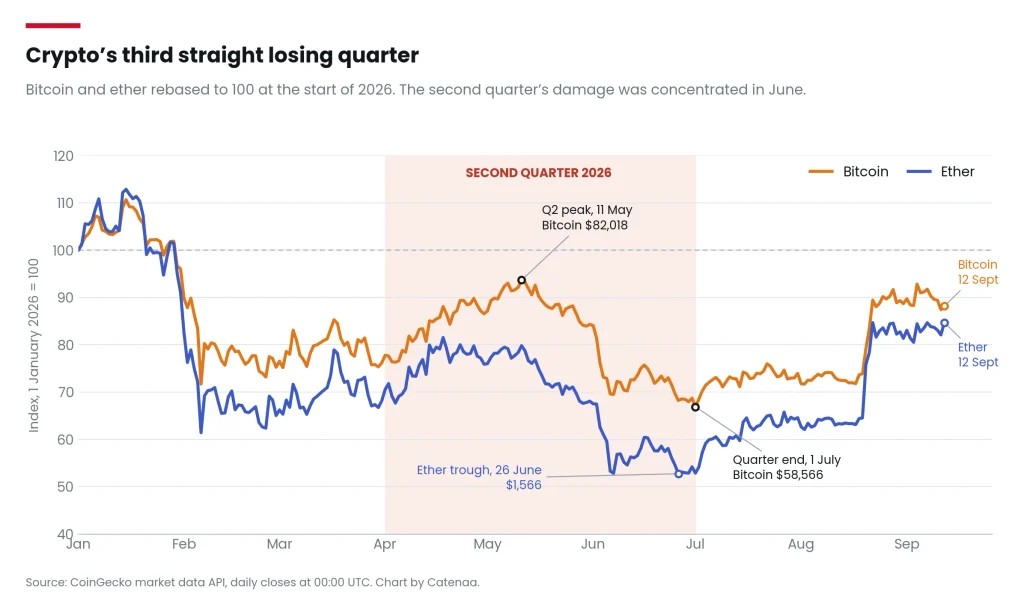
Every crypto market Q2 2026 scorecard tells the same story. It is not a happy one. The total value of all digital assets fell from about $2.4 trillion to roughly $2.1 trillion between April and June. That is a drop of 12.6%, according to CoinGecko’s quarterly industry report1. Bitcoin shed 14.2% over the three months. Ether, meanwhile, did far worse and lost 25.4%. Moreover, this was the third losing quarter in a row. That is the longest such run since 2022, as Bitwise Asset Management2 noted in its market review.
Numbers alone rarely explain a market, however. The better question is why the bid vanished. In fact, four forces overlapped during the quarter. Each one removed a different source of demand. That sequence matters because it shows what has to change before the next lasting rally can start.
What the crypto market Q2 2026 scorecard actually shows
The quarter was not uniformly bad from start to finish. April, for example, was strong. Bitcoin rose about 12% and won back $75,000. May then turned flat and choppy. June, by contrast, was violent. Bitcoin fell roughly 20% in a single month. It closed the quarter at $58,566 on 1 July, based on daily closing data from CoinGecko. Ether, likewise, hit its low of $1,566 on 26 June.
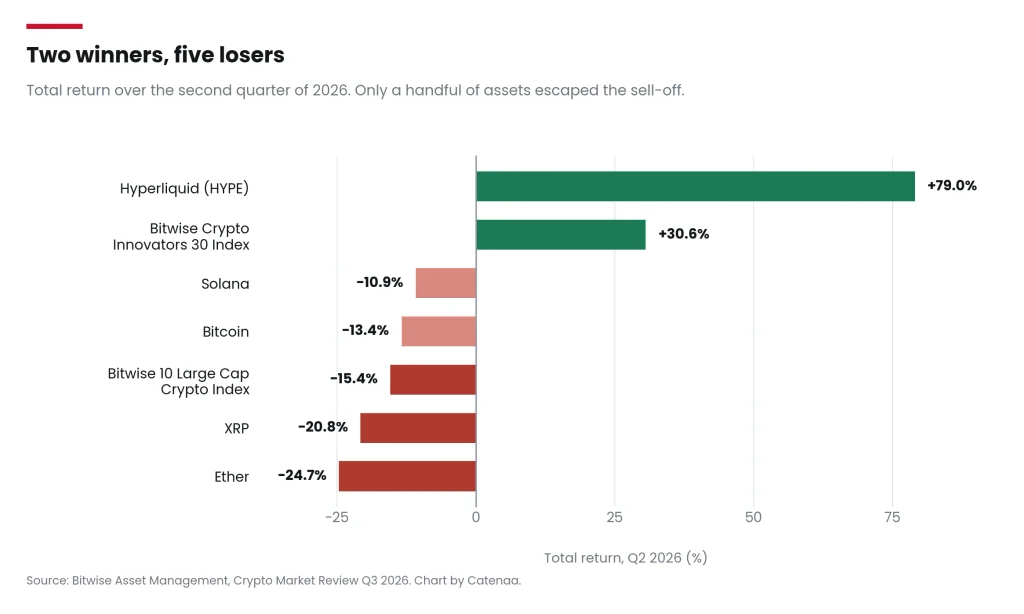
Breadth was just as poor. Eight of the ten members of the Bitwise 10 Large Cap Crypto Index ended the quarter in the red. Overall, the index itself fell 15.4%. Yet two areas clearly bucked the trend. Hyperliquid’s HYPE token gained 79.0%, driven by fast growth in on-chain perpetual futures trading. In addition, the Bitwise Crypto Innovators 30 Index rose 30.6%. That index tracks listed crypto-linked shares rather than tokens.
The gap is telling. Equity buyers were paying up for crypto plumbing while token prices sagged. In other words, investors were not writing off the industry. They were simply repricing the coins.
Driver one: the Federal Reserve stopped helping
To begin with, crypto entered 2026 expecting rate cuts. Instead, it got the opposite. A war-driven energy shock had begun in late February. It pushed Brent crude to $118 a barrel by 31 March, according to the US Energy Information Administration3. As a result, inflation picked up again. Fed staff put total PCE inflation at 4.1% in May, with core PCE at 3.4%. Those figures come from the minutes of the 16 to 17 June FOMC meeting4.
The Committee therefore held the federal funds target range at 3.50% to 3.75% for the quarter. Its implementation note of 29 April5 confirms that level. Unemployment sat at 4.3%, so the Fed had no labour-market reason to cut. Leadership also changed mid-quarter. Kevin Warsh then took over as chair on 22 May. Consequently, markets read the handover as hawkish.
This matters because bitcoin now trades as a long-duration risk asset, not as a hedge. Bitwise puts the 90-day rolling link between bitcoin and the S&P 500 at roughly 0.56 during the period. When real rates stay high, assets with no cash flow struggle. Crypto is simply the purest version of that trade.

Driver two: the ETF bid became an ETF exit
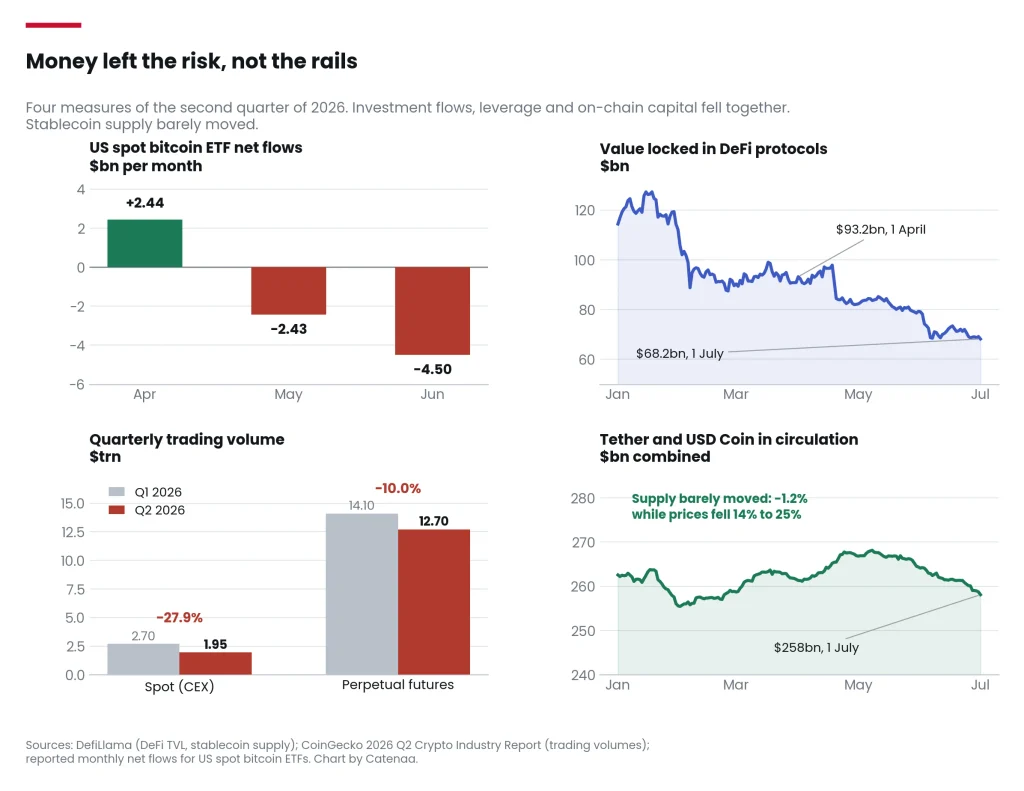
Since 2024, US spot Bitcoin exchange-traded funds have been the market’s steadiest source of price-blind demand. During the second quarter, that engine ran in reverse. April still looked healthy, with roughly $2.44 billion of net inflows. Then May flipped to about $2.43 billion in outflows. June was worse again, at close to $4.5 billion. That was the heaviest monthly exit in the product’s short history. Those monthly totals cover US funds only, so they do not tie exactly to the global quarterly figure below.
Across the full quarter, Bitwise records net outflows of $4.9 billion from spot bitcoin products worldwide. It calls this their worst quarter on record. In addition, spot ether products lost a further $1.2 billion. Fund flow data from CoinShares6 caught the same turn. By the start of June, bitcoin inflows for the year had shrunk to $1.2 billion. Two weeks earlier, they had stood at $3.9 billion. Overall, total assets in digital asset funds had slipped to $141 billion.
Redemptions weigh on price, though not always by the same route. Since July 2025, the SEC has allowed crypto ETPs to create and redeem shares in kind7. An authorised participant can therefore take delivery of bitcoin itself rather than cash. Under a cash redemption the fund sells coins directly. Under an in-kind redemption the participant holds the coins instead and may hedge, warehouse or sell them. Either path can add supply. However, the size and timing differ, so redemption totals are a signal of pressure rather than a measure of it.
Driver three: the corporate bitcoin bid lost its cheapest fuel
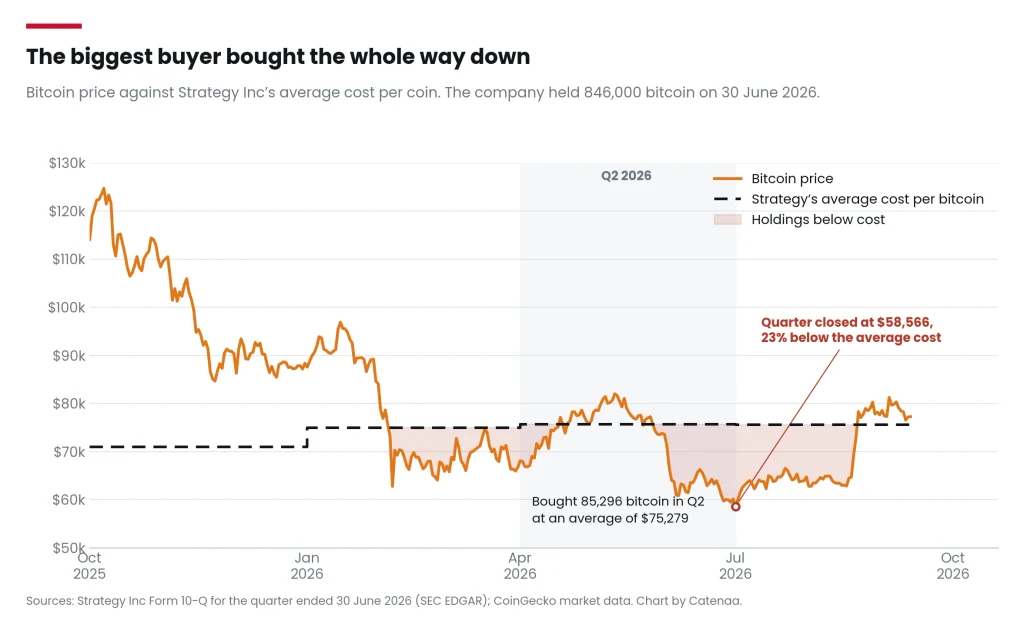
The sharpest evidence sits in a filing rather than a price chart. Strategy Inc is the largest corporate holder of bitcoin. It set out its second-quarter position in a Form 10-Q filed with the SEC8. The firm bought 85,296 bitcoin during the quarter for $6.42 billion. Notably, its average price was $75,279.
Bitcoin closed the quarter at $58,566. Strategy therefore ended June with about 846,000 bitcoin carried at $49.67 billion. Meanwhile, the original cost of that stack was $63.94 billion. Average cost per coin stood at $75,578, roughly 29% above the market price. As a result, the quarter produced an $8.32 billion paper loss on digital assets. Across the first half, the net loss reached $20.76 billion. Retained earnings swung from a $6.32 billion surplus in January to a $15.20 billion deficit by 30 June.
Two further details deserve attention. First, the company sold 1,395 bitcoin during the quarter at an average of $59,663. The filing states plainly that the proceeds funded dividends on preferred stock. Second, on 29 June its board approved buyback plans of up to $1.0 billion each for preferred and class A common shares. In short, bitcoin that once sat untouched now helps service preferred-stock obligations. Those buybacks began small, though. By 24 July the company had repurchased $25.0 million of STRC stock, funded through common-stock sales rather than coin sales.
The treasury-company model rests on one thing: a share price above the value of the coins held. Once that premium goes, issuing shares to buy more bitcoin destroys value instead of adding it. Strategy did not stop buying, however. Rather, the funding mix changed underneath it. Common-stock sales financed $5.19 billion of first-quarter purchases, yet only $0.96 billion in the second. Preferred issuance covered $5.46 billion of the rest. In other words, the cheapest fuel ran low while the buying continued on costlier terms.
Driver four: leverage finished the job in June
By late June, spot demand had thinned badly. Leverage then did what leverage always does. Forced selling swept through perpetual futures as bitcoin broke below $60,000. Single sessions wiped out well over a billion dollars of positions. Consequently, prices fell below levels that spot flows alone would have held.
Activity data confirms the retreat. Spot volume on centralised exchanges fell 27.9% quarter on quarter to $1.95 trillion. Similarly, perpetual futures volume declined 10.0% to $12.7 trillion. Average daily trading across the whole market dropped 20.9% to $93.1 billion. Value locked in DeFi protocols fell 26.9% during the quarter to $68.2 billion, according to DefiLlama. Falling collateral and forced selling fed on each other.
Note the order of events. Policy set the tone. Fund outflows removed the steady buyer. Then corporate selling took away the backstop. Leverage merely delivered the final blow. Traders who watched only the June candles saw the symptom rather than the cause.
How this slump differs from the 2022 crash
Comparisons with 2022 are tempting, yet they mislead. Back then, users fled the system itself after a chain of blow-ups. Indeed, combined Tether and USD Coin supply fell 19.6% between its April 2022 peak and its December trough.. This time, the money stayed on the rails and simply stopped taking risk.
Scale tells the same story. Bitwise notes that the market is quoting bear-market prices for an industry roughly twice the size it was at the last cycle’s low. Ethereum transaction activity is about thirteen times higher than it was at that bottom. Likewise, value locked in DeFi is more than 60% higher. The price is cyclical. The usage is not.
One more contrast stands out. In 2022, the pain came from credit: lenders, funds, and exchanges that had borrowed against each other. In 2026, the pain came from flows: fund redemptions, a stalled corporate buyer, and crowded futures positions. Flow problems clear faster than credit problems, because no one has to be wound up. That distinction helps explain how quickly prices recovered once the selling stopped.
What held firm during the crypto market Q2 2026 drawdown
Here, the analysis turns more constructive. Stablecoin supply is the clearest measure of capital that stays inside the system. It barely moved. Total stablecoin value eased just 1.6% to $305.1 billion. That was its first quarterly fall since the third quarter of 2023. For instance, Tether held steady at about $184 billion. Similarly, USD Coin slipped 4.8% to $73.5 billion.
Bitwise notes that stablecoins now settle roughly 2.3 times the volume Visa does. They also hold more US Treasury bills than most countries. Payments demand, in short, proved indifferent to the token slump.
One more rotation deserves a mention. The majors did not fall evenly. Ether lost almost twice as much as bitcoin, while XRP landed between the two. Investors therefore cut the riskier end hardest, yet they stayed inside the asset class. Binance, meanwhile, still handled 38.7% of spot exchange volume. Liquidity, in short, stayed concentrated in the largest venues.
Other pockets grew outright. Prediction market volume rose 48.7% to $113.8 billion. It peaked at $52.8 billion in June, as macro and geopolitical worries drove hedging demand. In addition, Hyperliquid entered the top ten by market value. Crypto shares rallied 30.6%. These are not the signs of a dying industry.
Policy, however, offered no offset. The Senate Banking Committee advanced crypto market structure legislation in May. However, a floor vote then slipped to September. The regulatory clarity many investors had pencilled in for the first half of 2026 simply did not arrive in time.
What the Q2 2026 crypto market data signals for the rest of the year
Prices have already moved a long way since the quarter ended. Bitcoin traded near $76,400 on 18 September. That is about 30% above its quarter-end close. Ether gained almost 56% across the same eleven weeks. Solana, likewise, rose 38%. The bounce is real, though it does not undo the quarter’s lesson.
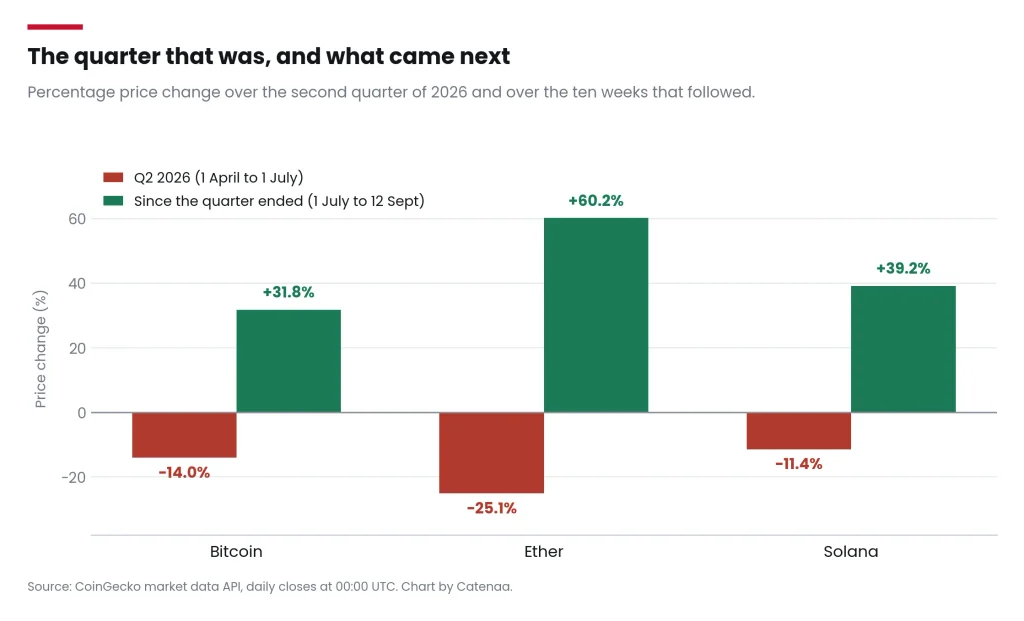
That lesson is simple. Crypto prices now rest on three flows, and each can reverse quickly: ETF creations, corporate treasury buying and leveraged positions. All three ran negative at once during the second quarter. Conversely, all three can turn friendly again. That symmetry explains the speed of the recovery.
Investors should therefore watch flows rather than stories. Steady ETF creations would show that allocators are rebuilding. A recovery in treasury-company share prices above coin value would revive corporate demand. Equally, the passage of the market structure bill would remove a lingering discount. Above all, a credible path back to 2% inflation would matter most, because it would loosen the constraint that defined the quarter.
Meanwhile, the durable signal sits beneath the prices. Stablecoin settlement, exchange plumbing, and listed crypto shares all held up while tokens fell. The second quarter of 2026 repriced trading capital. It did not deliver a verdict on the technology. Telling those two things apart is the whole discipline of investing in this asset class.
- coingecko.com: https://www.coingecko.com/research/publications/2026-q2-crypto-report ↩︎
- bitwiseinvestments.com: https://bitwiseinvestments.com/crypto-market-insights/crypto-market-review-q3-2026 ↩︎
- eia.gov: https://www.eia.gov/todayinenergy/detail.php?id=67424 ↩︎
- federalreserve.gov: https://www.federalreserve.gov/monetarypolicy/fomcminutes20260617.htm ↩︎
- federalreserve.gov: https://www.federalreserve.gov/newsevents/pressreleases/monetary20260429a1.htm ↩︎
- coinshares.com https://coinshares.com/corp/insights/research-data/fund-flows-01-06-26/ ↩︎
- sec.gov: https://www.sec.gov/newsroom/press-releases/2025-101-sec-permits-kind-creations-redemptions-crypto-etps ↩︎
- sec.gov: https://www.sec.gov/Archives/edgar/data/1050446/000105044626000044/mstr-20260630.htm ↩︎