

The S&P 500 is just one index among thousands. Some track whole markets, others a single industry, theme, or region. Here is a clear tour of the wider index universe.
In Summary
Broad market indexes track a wide slice of a market and serve as default benchmarks.
Sector indexes follow one industry, built on the 11 standard GICS sectors.
Thematic indexes follow a trend across sectors, with higher focus and higher risk.
Regional and global indexes group companies by location, yet the US still dominates many of them.
Indexes also track bonds, commodities, and volatility, such as the VIX “fear gauge”.
Total return includes reinvested dividends, so it always outpaces price return.
The S&P 500 grabs most of the headlines. Yet it is only one index among thousands. Some indexes track entire markets. Others follow a single industry, a theme, or a whole region. A few even measure bonds, commodities, or fear itself. So this article maps that wider universe. Once you know the main types, you can pick the right gauge for almost any question. Think of it as learning the different instruments in an orchestra. Each one plays a distinct part.
A Map of the Index Universe
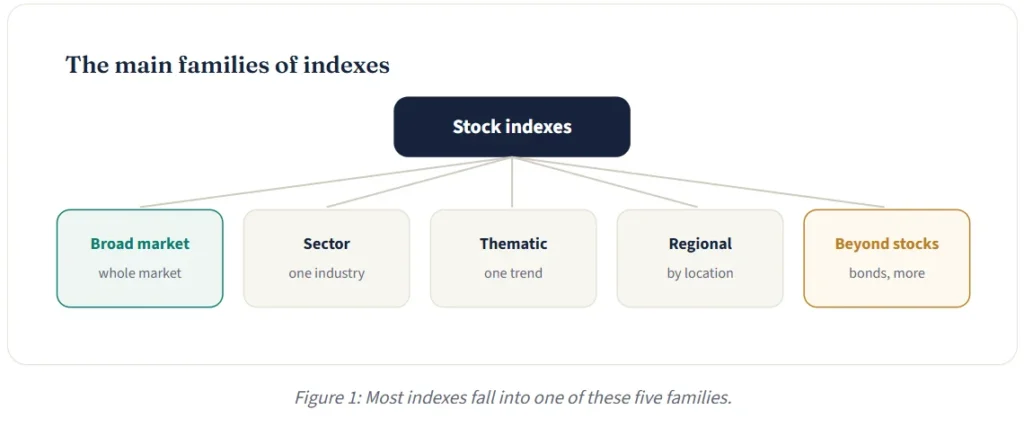
Indexes come in many shapes, yet they sort into a few clear families. Some group companies by how much of the market they cover. Others group them by industry, by theme, or by location. A final family steps outside shares entirely.
Knowing these families helps in two ways. First, it tells you what an index actually measures. Second, it stops you comparing two indexes that track very different things. The map below lays out the main branches. We will then explore each one with real examples. None of these families is better than the others. Each simply answers a different question about the market.
Broad Market Indexes
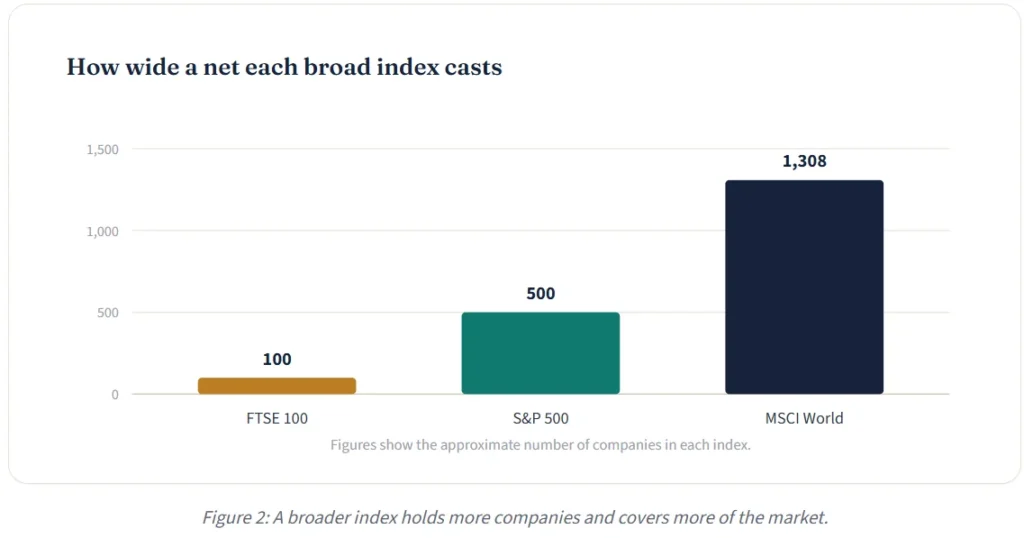
Broad market indexes aim for the big picture. They track a wide slice of a market, so they work as a general health check. The S&P 500 is the classic example, covering 500 large U.S. companies. The MSCI World goes wider, holding about 1,308 companies across 23 developed countries.
These indexes share one goal. They want to represent a market as a whole, not a narrow corner of it. As a result, investors use them as default benchmarks. Most index funds also track a broad index, which is why they appear in so many pensions. A broad index answers a simple question. How is the market doing overall?
Some broad indexes reach even wider. The Wilshire 5000, for example, once aimed to hold almost every U.S. stock. The wider the net, the closer the index comes to the true market average. This is exactly why broad indexes form the backbone of long-term investing.
The chart below compares the breadth of three popular broad indexes. Notice how the number of companies signals how wide each net is cast.
Sector Indexes
Sector indexes zoom in on one part of the economy. Instead of the whole market, they track a single industry group. Technology, healthcare, and energy each have their own index.
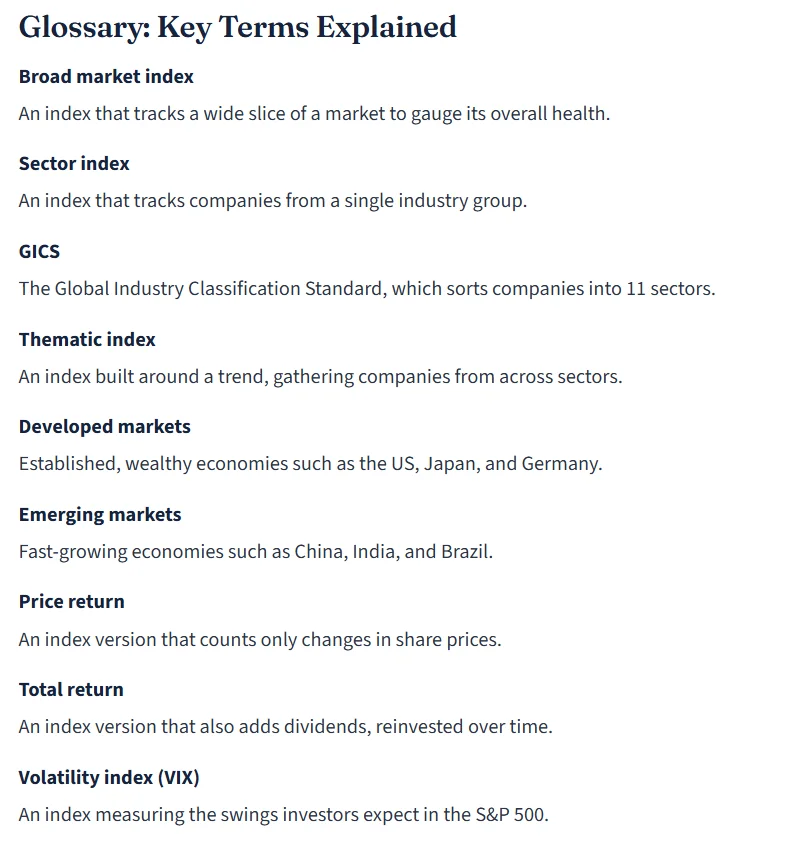
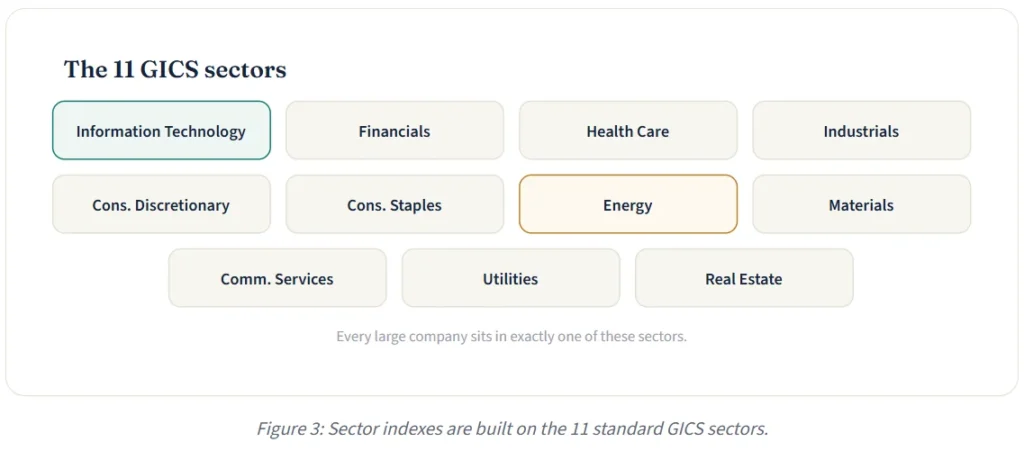
Most providers organise companies using a shared system. It is called the Global Industry Classification Standard, or GICS. S&P and MSCI created it together in 1999. Today, GICS sorts every large company into one of 11 sectors.
Sector indexes serve a clear purpose. They let investors track or back a single slice of the market. For instance, an energy index can soar while a technology index falls. Professional investors use this to rotate between sectors as the economy shifts. Picture the economy as a shopping mall with eleven departments. A sector index simply tracks one department at a time. When shoppers crowd into electronics, that sector index climbs. The grid below shows all eleven GICS sectors at a glance.
Thematic Indexes
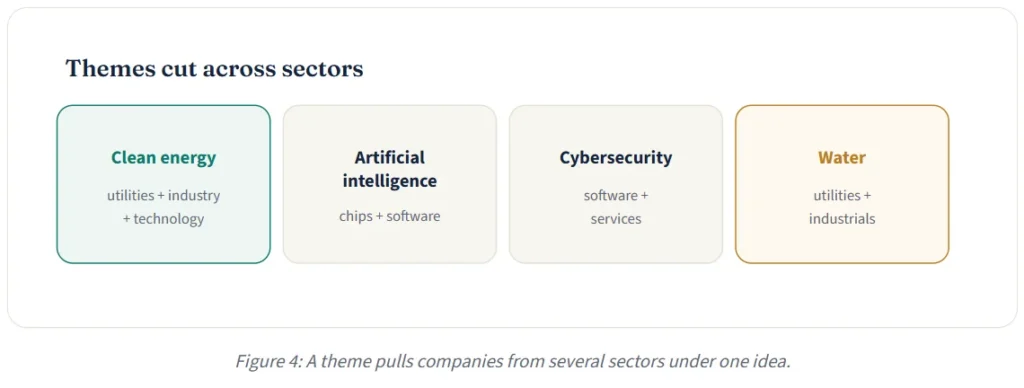
Thematic indexes follow an idea rather than an industry. They gather companies linked to a single trend, even across different sectors. Think clean energy, artificial intelligence, cybersecurity, or water.
These indexes cut across the usual boundaries. A clean-energy theme might mix utilities, industrials, and technology firms. Investors use them to back a long-term story they believe in. However, themes can be narrow and crowded, so they often swing harder than broad indexes. In other words, the extra focus brings extra risk. Thematic indexes also change faster than broad ones. New companies join as a trend grows, and others drop out as it fades. So the membership can shift quickly from year to year. The examples below show how far a single theme can reach.
Regional and Global Indexes
Some indexes are defined by geography. They group companies by country or region instead of industry. This makes them powerful tools for global investors. They answer a different question entirely. Not how is the market doing, but how is this part of the world doing?
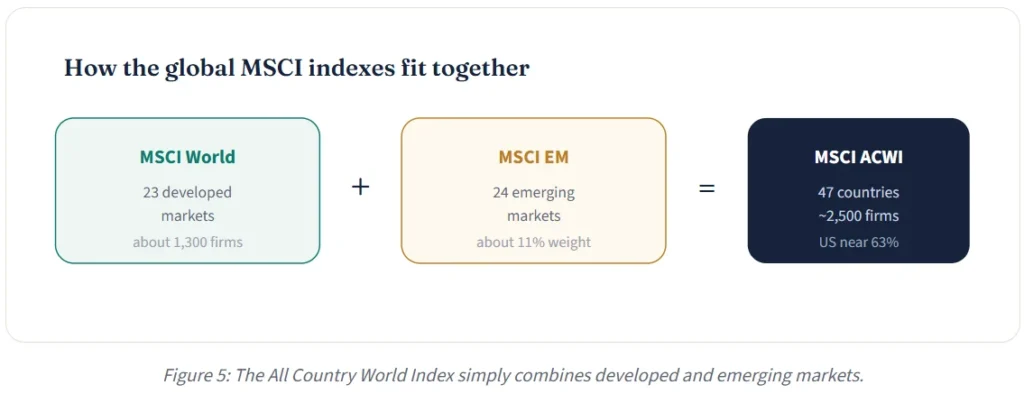
The MSCI family shows the idea clearly. The MSCI World tracks 23 developed markets, such as the U.S., Japan, and Germany. The MSCI Emerging Markets covers 24 developing economies, including China, India, and Brazil. Combine the two, and you get the MSCI ACWI, the All Country World Index. It spans 47 countries and around 2,500 companies.
One detail surprises many readers. Even inside a “world” index, the United States dominates. American firms make up roughly 63% of the MSCI ACWI. So a global index can still lean heavily on one country. Emerging markets, by contrast, hold a small weight despite their large populations. This gap explains why many investors add a separate emerging-markets fund. Emerging economies drive a large share of global growth, yet they sit small inside a world index. A dedicated fund restores some of that balance. The diagram below shows how the pieces fit together.
Beyond Stocks: Bond, Commodity, and Volatility Indexes
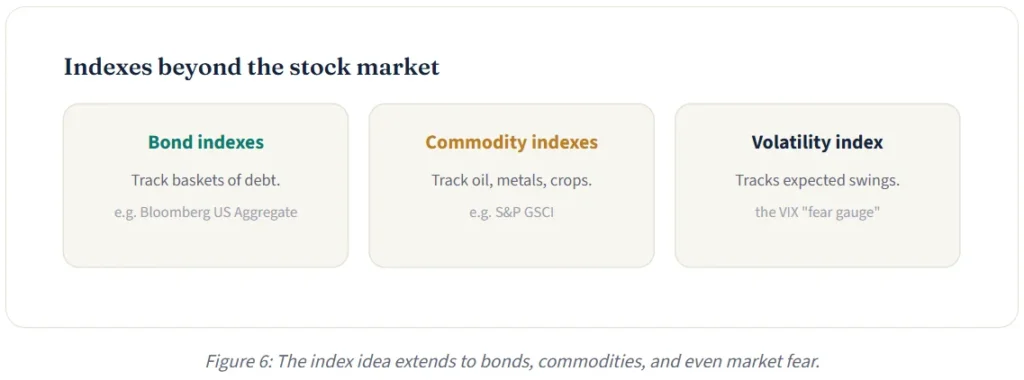
Indexes are not limited to shares. The same idea works for almost any market. Bond indexes track baskets of government and company debt. Commodity indexes follow the prices of oil, metals, and crops. Together, these indexes let investors watch many markets through one simple number each. That convenience is the whole appeal of an index.
One special index measures emotion instead of price. The VIX, run by the Cboe, gauges how much swing investors expect in the S&P 500 over the next 30 days. Traders nickname it the “fear gauge”, because it spikes when markets panic. It usually rises as shares fall. Each of these indexes plays a different role. Bond indexes help investors track the safer, income side of a portfolio. Commodity indexes reveal pressure on prices, such as a jump in oil. The VIX, meanwhile, offers a quick read on market nerves. The cards below introduce these three non-stock indexes.
Price Return vs Total Return
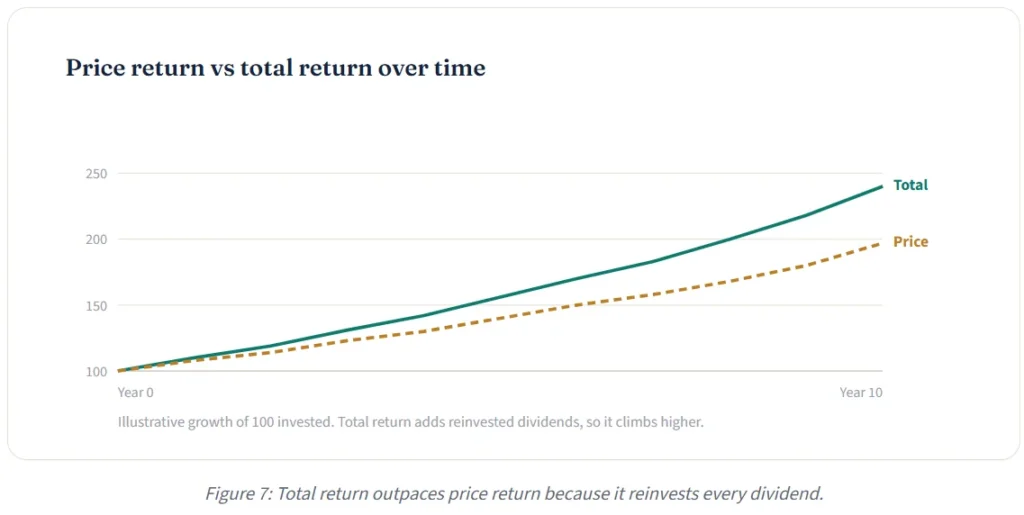
Here is a subtle point that trips up many investors. The same index can be quoted in two ways. A price-return version counts only share-price changes. A total-return version also adds reinvested dividends. Dividends are the regular cash payments many companies make to shareholders. Reinvesting them buys more shares, which then earn more dividends. Over decades, this snowball effect grows powerful.
The gap matters more than it sounds. Over years, reinvested dividends can lift returns by a large margin. So a total-return figure usually sits well above its price-return twin. The MSCI World, for instance, is published in price, net, and gross versions. Always check which one a chart shows before you compare. Consider a simple case. Two charts of the same index might show very different growth. One could rise 100% while the other rises 160%, purely because of dividends. Neither chart is wrong, yet they tell different stories. The chart below shows how the two versions drift apart over time.
Reading Indexes as Benchmarks
Indexes shine as benchmarks. A fund’s return means little until you compare it with the right index. Beat the benchmark, and the manager added value. Trail it, and a simple index fund might have done better. In this sense, an index sets the bar that every fund must clear.
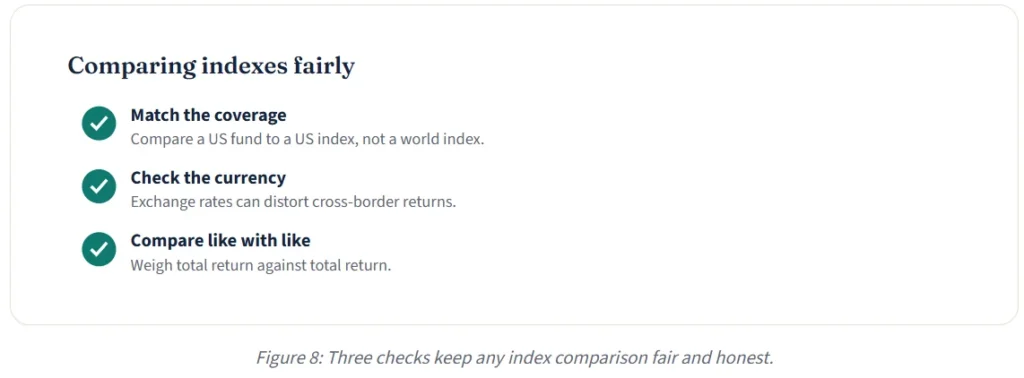
Fair comparison needs care, though. Match the coverage first, since a U.S. fund should not be judged against a world index. Check the currency next, because exchange rates can distort cross-border results. Finally, compare like with like on dividends, weighing total return against total return. The checklist below keeps your comparisons honest. This is the heart of the active-versus-passive debate. Most active funds aim to beat a benchmark, yet many fall short over time. That track record is a big reason index funds have grown so popular. Our final article then turns this theory into action with index funds and ETFs.