

A sandwich sold in more than 100 countries has become one of finance’s most quoted currency gauges. Here is how it works, what its July 2026 reading shows, and where it quietly misleads you.
In Summary
One burger, one division. Divide the local Big Mac price by the American price. Then compare the result with the market exchange rate.
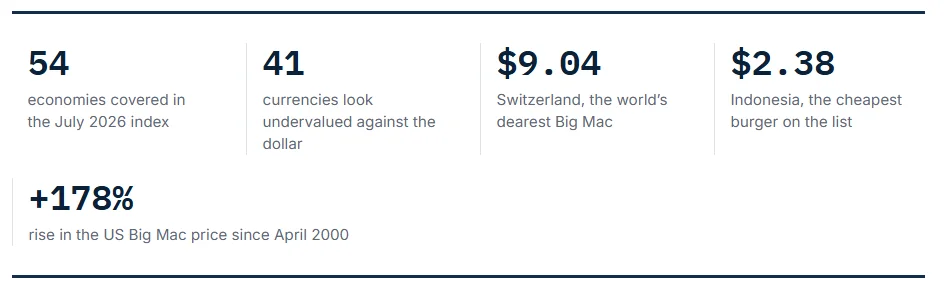
Most currencies look cheap. In July 2026, 41 currencies traded below burger parity against the dollar and only 12 above. Indonesia carried the deepest discount, at 61.7%.
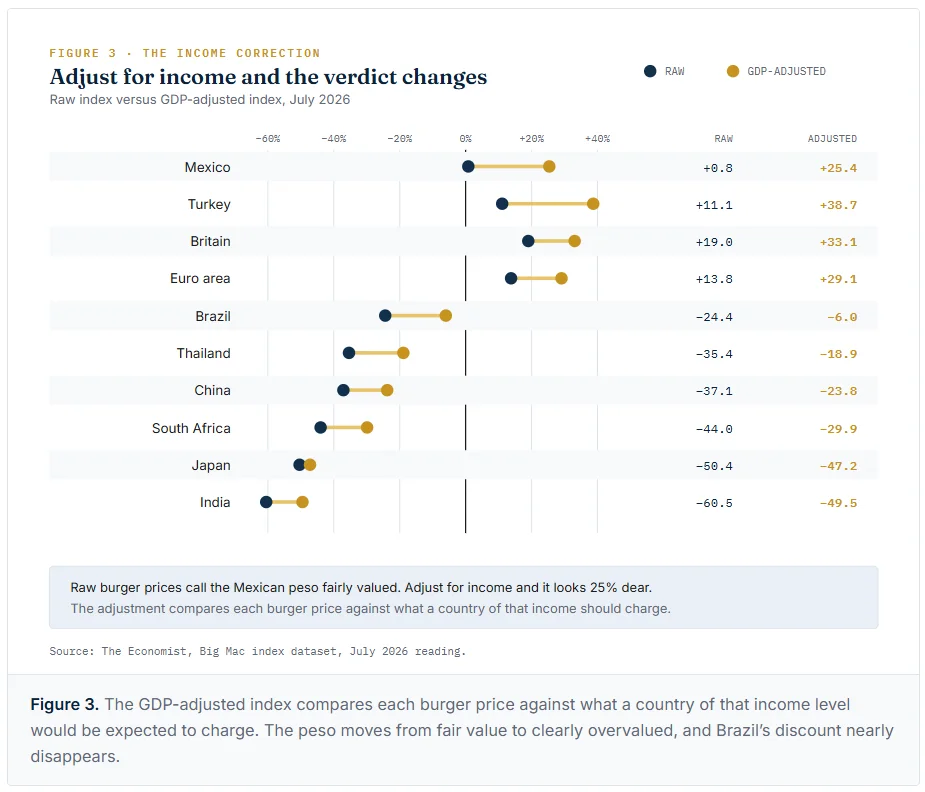
Income changes the verdict. The GDP-adjusted index changes several calls. For example, the Mexican peso moves from fair value to 25.4% overvalued once you adjust for income.
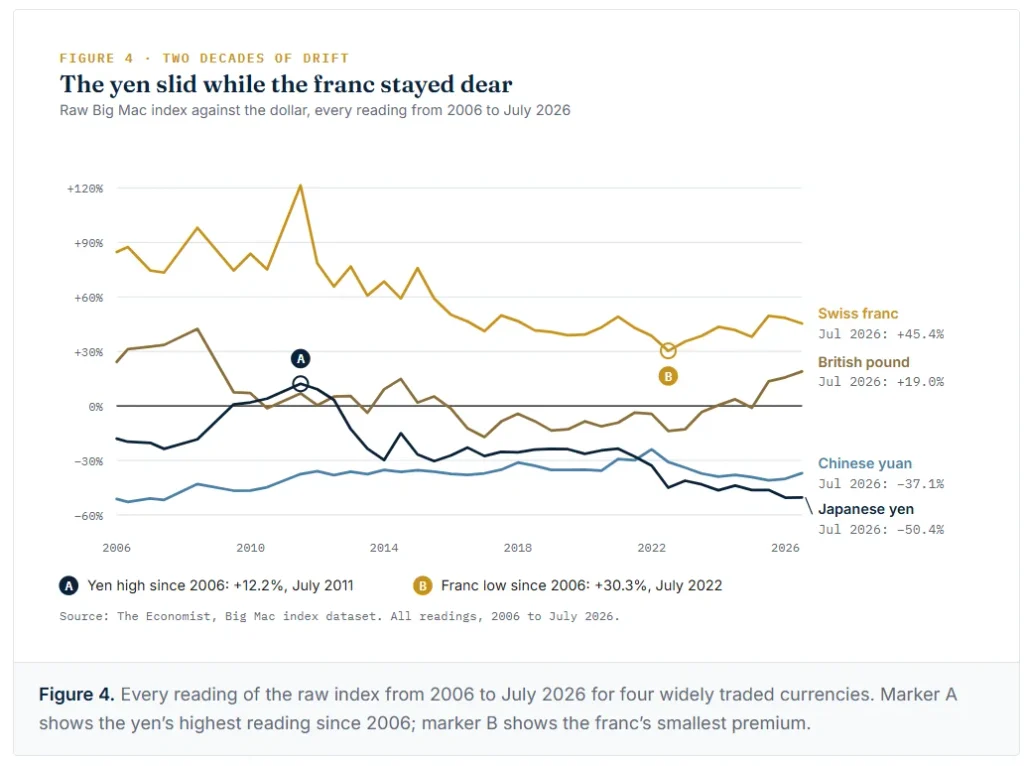
The yen tells the clearest story. It moved from a 12.2% premium in July 2011 to a 50.4% discount in July 2026. Throughout, Japanese rates sat far below those abroad.
Judge a currency against its own normal gap. Raw gaps can persist for decades. Yet Cumby found that swings around each currency’s usual gap halve in about a year. They also carry some forecasting power.
Walk into a McDonald’s in Zurich, and a Big Mac costs 7.30 Swiss francs. Order the same sandwich in Jakarta, and you pay 43,000 rupiah. Convert both at market exchange rates and the gap turns startling. The Swiss burger costs $9.04. The Indonesian one costs $2.38.
Same beef. Same bun. One recipe. But nearly four times the price.
That gap is the entire point of the Big Mac index. The Economist launched it in September 1986 as a light-hearted test of whether currencies sit at their correct level. Four decades later, the joke has outlived most of its critics. In fact, it now shows up in serious research. Federal Reserve economists write papers about it. Textbooks teach it. Fund managers glance at it before a currency call. So what does a burger really tell you about money?
The theory hiding inside the sandwich
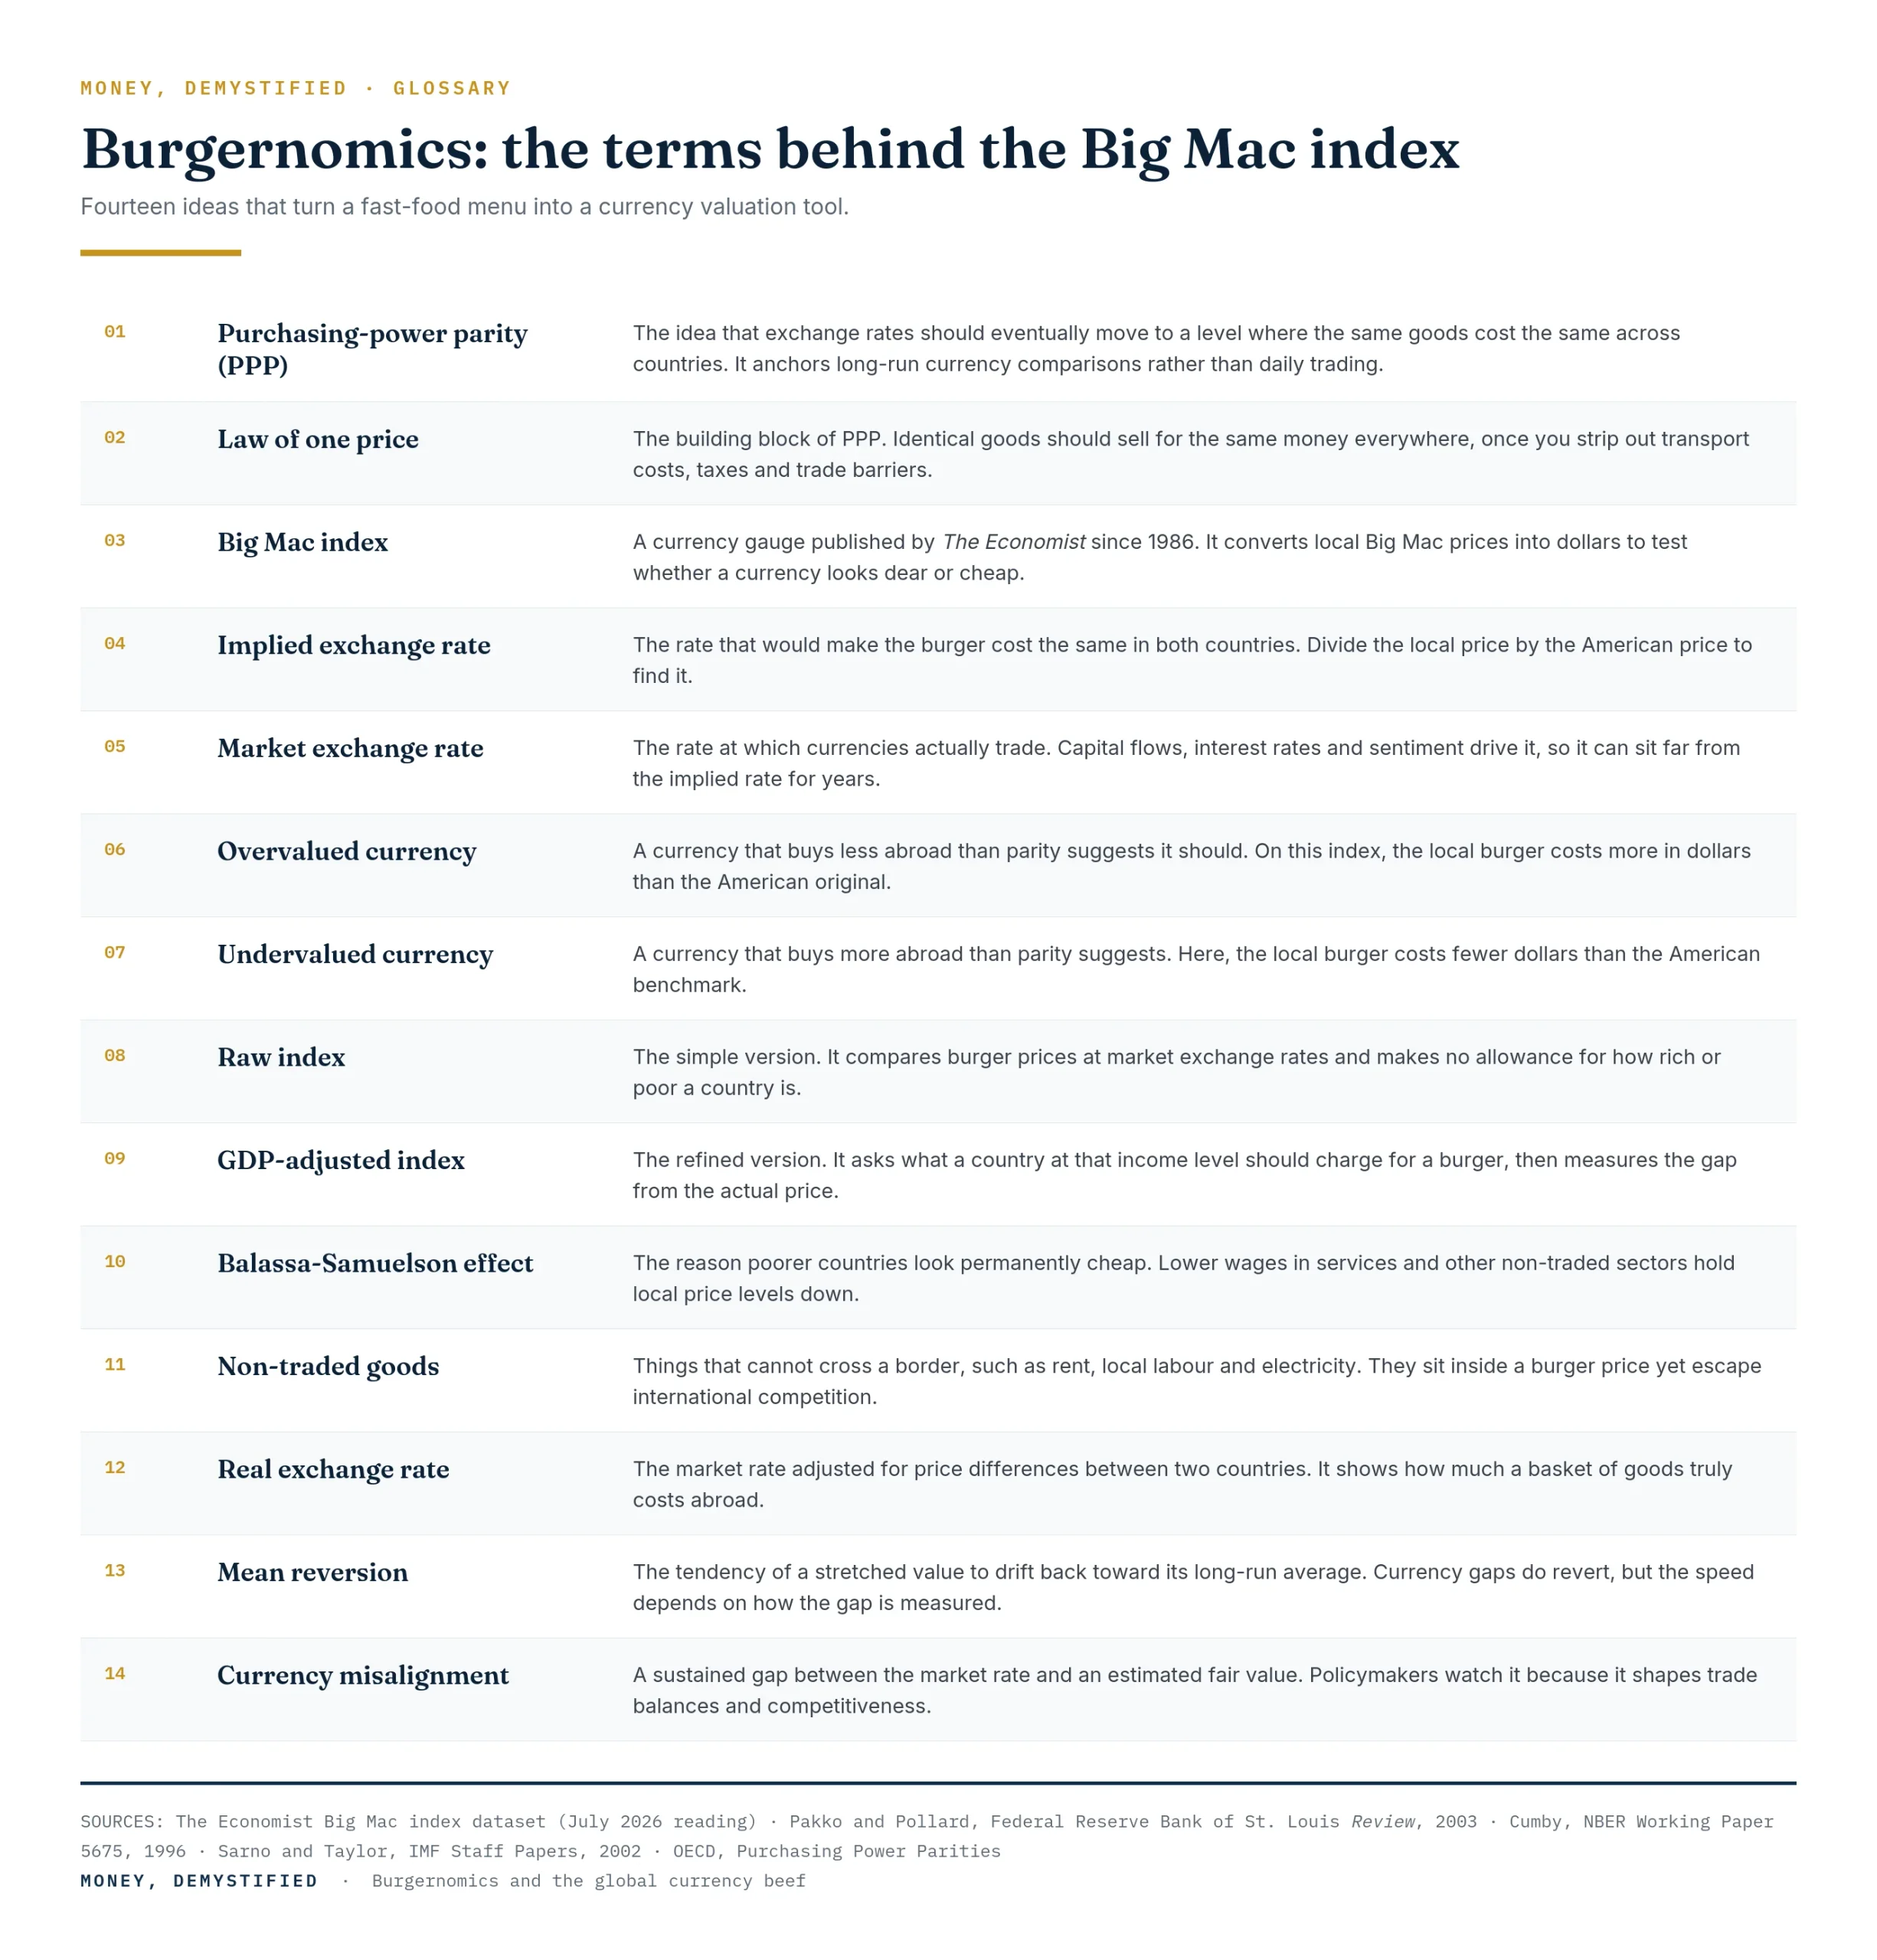
The index rests on purchasing-power parity, usually shortened to PPP. The claim sounds simple. Over long stretches of time, exchange rates should drift toward the level that makes identical goods cost the same everywhere.
That claim grows out of an older principle called the law of one price. If a good travels easily, competition should erase price gaps between countries. Otherwise, traders would buy cheap in one market and sell dear in another until the gap closed.
A Big Mac travels terribly. After all, nobody ships one from Jakarta to Geneva. However, that flaw doubles as the appeal. Each burger bundles beef, bread, rent, wages, electricity and advertising into one published number. So it works like a ready-made basket of goods that anyone can price in an afternoon.
Serious institutions build proper baskets instead. The OECD and the World Bank’s International Comparison Program survey hundreds of items across dozens of economies. Those surveys take years. The burger, by contrast, takes one division sum.
How burgernomics does the arithmetic
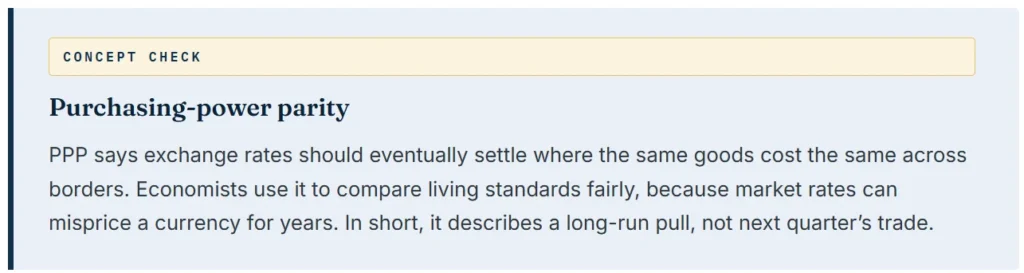
The whole method needs one division and one comparison.
Start with India. McDonald’s sells no beef Big Mac there, so the index prices the chicken Maharaja Mac instead. It cost 236.25 rupees in July 2026. The American Big Mac cost $6.22. Divide 236.25 by 6.22 and you get 37.98. That figure is the implied exchange rate. In other words, it is the rupees per dollar that would make both burgers cost the same.
Now check reality. Markets priced the dollar at 96.26 rupees. Burger parity says 37.98. Measured against the market rate, the rupee therefore looks 60.5% undervalued.
Now run the sum for Switzerland. This time the sign flips. A Swiss Big Mac at 7.30 francs implies 1.17 francs per dollar. Yet markets charged only 0.81 francs. So the franc looks 45.4% overvalued, the widest premium on the list.
The July 2026 scoreboard
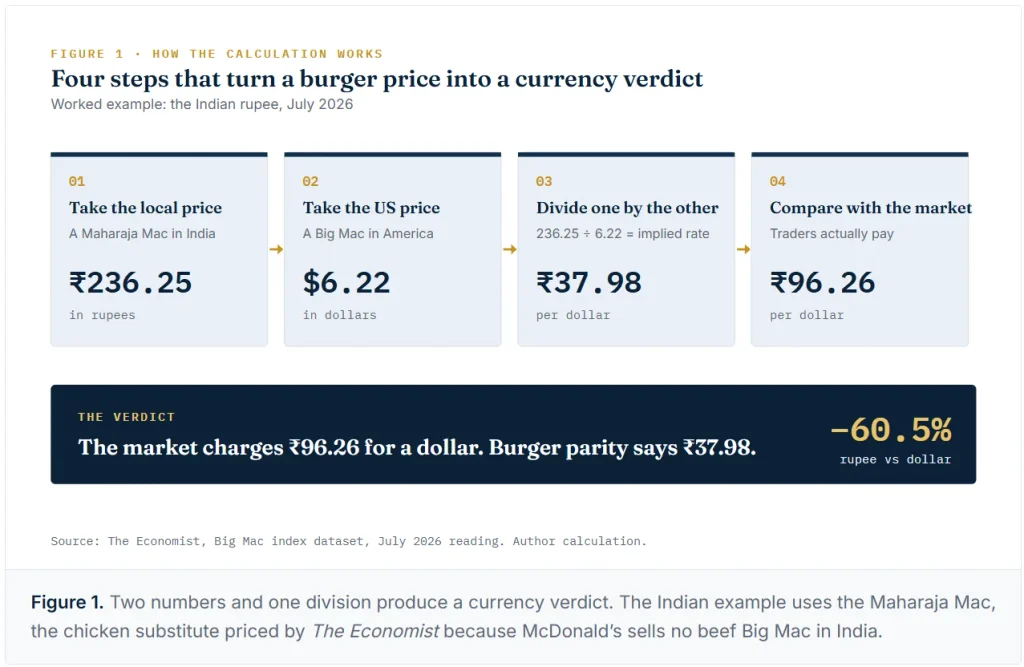
The July 2026 reading covers 54 economies. Against the dollar, just 12 currencies look dear. Meanwhile 41 look cheap.
Switzerland tops the table again, as it has for most of this century. Uruguay follows closely at 43.7% overvalued. Norway, Colombia, Israel, Britain and Sweden complete the expensive end.
In contrast, Indonesia, Taiwan, India and the Philippines sit at the cheap end. Each one carries a discount above 55%. Japan now sits close behind them, which would have shocked an investor in 2011.
The American benchmark keeps climbing too. A US Big Mac cost $2.24 in April 2000. By July 2026 it cost $6.22. That is a rise of roughly 178%, or close to 4% a year. Researchers at the Federal Reserve Bank of St. Louis tested that trend. They found burger prices track the American consumer price index closely. Still, the two series drift apart during inflation shocks.
Why poorer countries always look cheap
Here sits the index’s deepest flaw. Cheap burgers cluster in poor countries, and they stay cheap year after year. A signal that never changes is not really a signal.
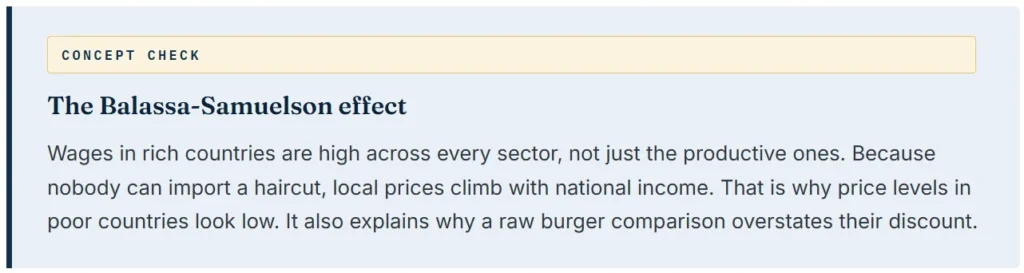
The explanation carries a name: the Balassa-Samuelson effect. Rich countries are far more productive in manufacturing than poor ones. That productivity lifts wages across the whole economy, including in haircuts, rent, cleaning and restaurant shifts. You cannot import a haircut or a lease. As a result, everything non-traded costs more in wealthy places.
Local labour, rent and utilities make up much of what a Big Mac costs, as Pakko and Pollard point out. So the raw index punishes poor countries by design, not by evidence.
The Economist answered that criticism with a second version. The GDP-adjusted index asks what a country at a given income level ought to charge for a burger. Then it measures the gap between that figure and the actual menu price.
The rework changes several verdicts. Raw numbers call the Mexican peso fairly valued at plus 0.8%. Adjust for income and the peso looks 25.4% overvalued. Brazil’s discount shrinks from 24.4% to just 6%. India’s narrows from 60.5% to 49.5%. So investors who quote the raw figure alone are quoting half the story.
The yen’s fifteen-year slide
One currency shows the index at its most useful. In July 2011 the Japanese yen looked 12.2% overvalued. By July 2026 it looked 50.4% undervalued.
The swing did not come from burger inflation in Tokyo. It came from the exchange rate. The Bank of Japan kept rates at or below zero until March 2024. Other central banks, by contrast, raised theirs sharply from 2022. So capital chased the wider yields abroad, and the yen weakened year after year. The Bank has tightened since, but gradually, reaching 1% only in June 2026.
In contrast, the Swiss franc travelled the opposite road. It has kept a large premium for two decades and has topped the table in every reading since 2021. Even its low point, in July 2022, still showed a 30.3% premium.
Still, notice what the index cannot do. It flagged the yen as cheap in 2022, again in 2024, and again in 2026. But anyone who traded on that signal alone waited years for payment.
Where the burger misleads
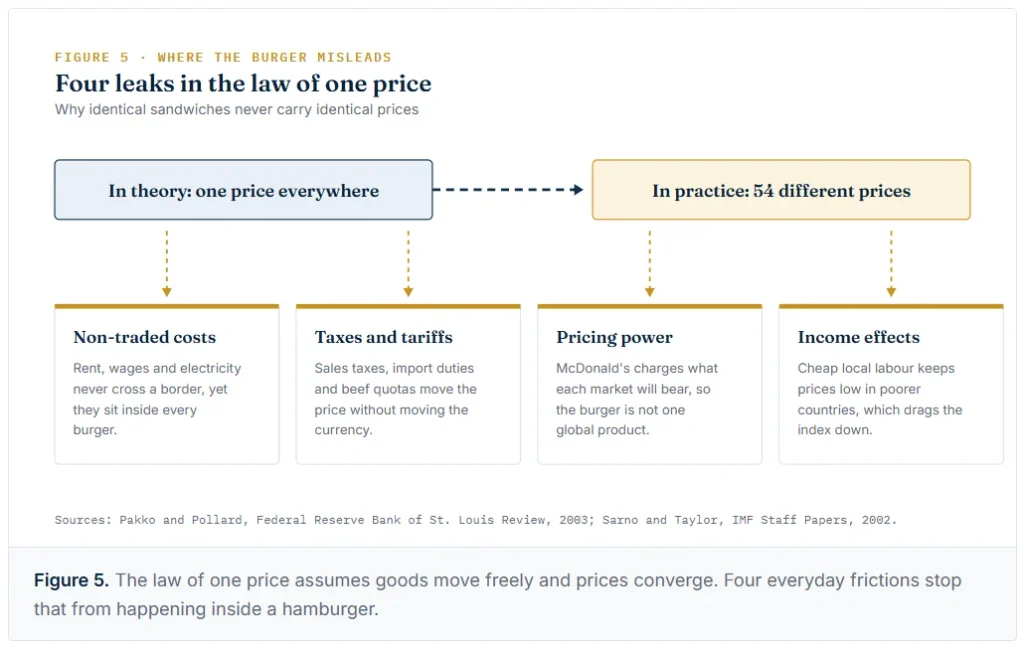
Four leaks weaken the comparison.
First, non-traded costs dominate. Rent, wages and local electricity never cross a border, yet they sit inside every price on the menu.
Second, taxes distort. Sales taxes, import duties and beef quotas move menu prices without touching the currency at all.
Third, McDonald’s is no passive price taker. The chain charges whatever each market will bear. For example, reporting from Argentina in the early 2010s described Big Macs kept oddly cheap while other menu items rose. That pattern hinted at political pressure on a closely watched number.
Fourth, the burger is not identical everywhere. India uses chicken. So the law of one price faces a test on a product that quietly differs.
Academic work adds an important twist. Robert Cumby studied the question for the National Bureau of Economic Research in 1996. He found large, lasting gaps for several currencies. However, he then stripped out each currency’s usual gap. What remained faded fast, with a half-life of about one year. A 10% undervaluation predicted roughly 3.5% appreciation the following year. Michael Pakko and Patricia Pollard reached a related view in the Federal Reserve Bank of St. Louis Review. They showed that the burger does nearly as well as far bigger price surveys.
How to actually use the index
Treat the burger as a thermometer rather than a trading signal.
For investors, the useful signal lies in direction, not in the level. A currency parked at a 50% discount for a decade tells you almost nothing new. But a currency that swings more than 60 points in fifteen years tells you plenty. The yen did exactly that. So read the GDP-adjusted series first. Then compare each currency with its own usual gap, as Cumby did, rather than with zero.
For students, meanwhile, the index remains a great teaching device. It turns an abstract theory into one division sum that anybody can repeat with a receipt.
For travellers and workers, it doubles as a cost-of-living map. It explains why a salary converted at market rates buys a very different life in Manila than in Oslo.
The Economist has always called the index light-hearted. That honesty is exactly why it endures. Simple tools survive because people actually use them. In the end, a hamburger got millions of readers thinking hard about exchange rates. No weighted price index has ever managed that.
The Big Mac index is a rough gauge of currency valuation, not investment advice. Currency markets respond to interest rates, capital flows and policy, none of which appear on a menu board.