

November 21, 2026 – October borrowing rose 5.2% to £17.0 billion, and debt interest hit an October record. Lower annual borrowing alone will not stop the debt ratio from rising.

In Summary
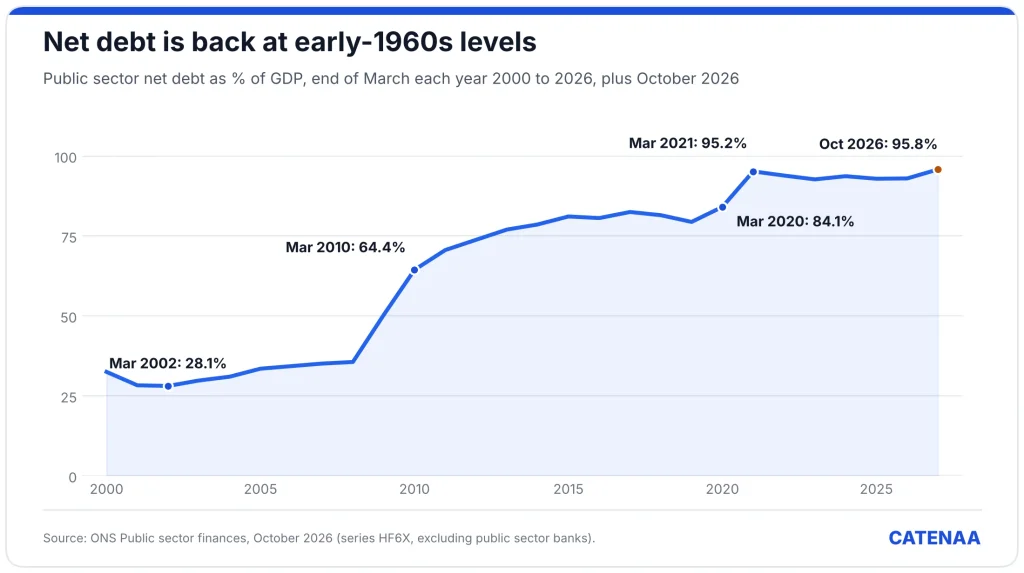
UK debt reached £3,058.3 billion at the end of October, or 95.8% of GDP.
October borrowing rose 5.2% to £17.0 billion, the third-highest October on record.
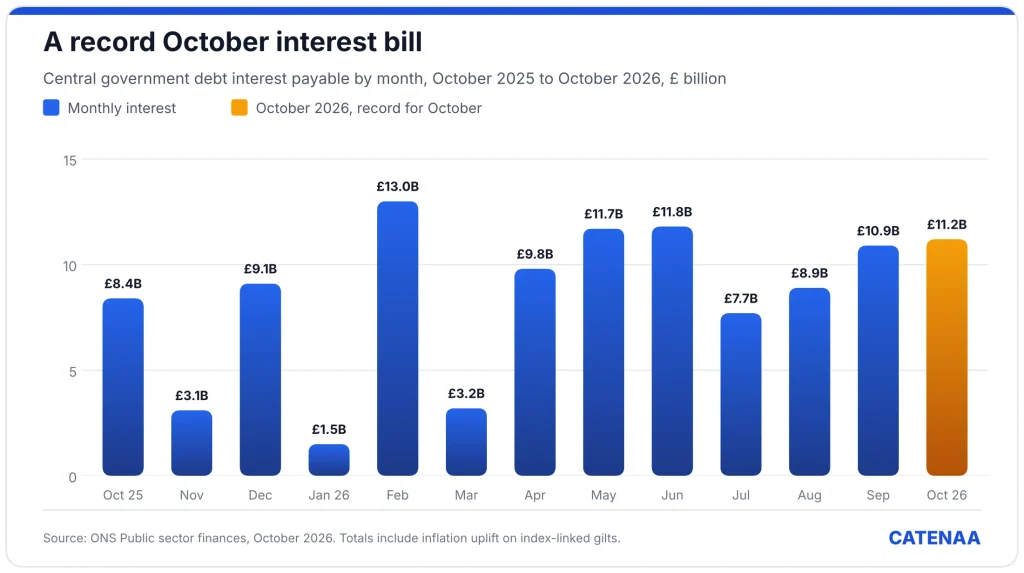
Central government interest hit £11.2 billion, the highest October figure since 1997.
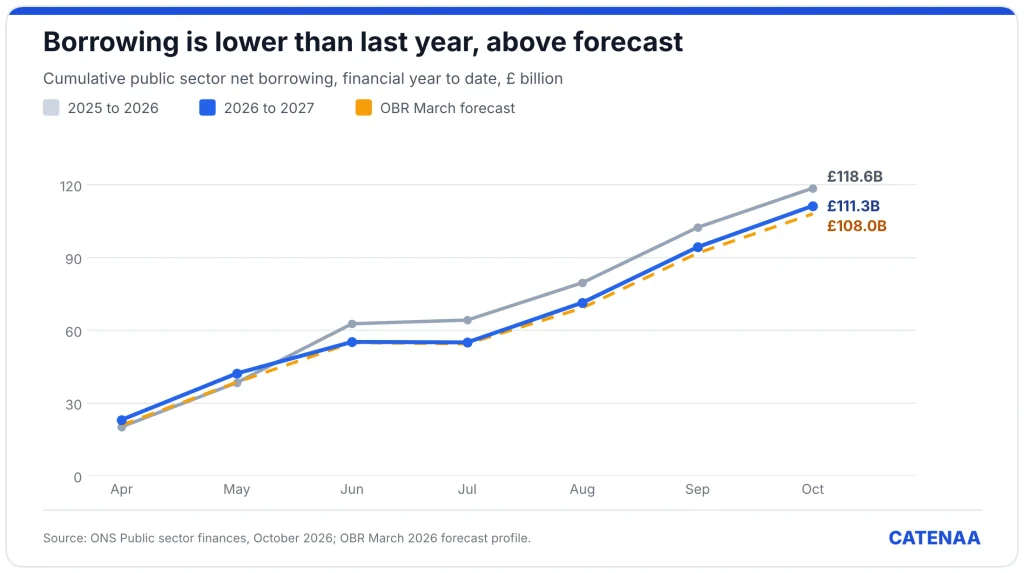
Year-to-date borrowing fell 6.1%, but still ran £3.3 billion above the March forecast.
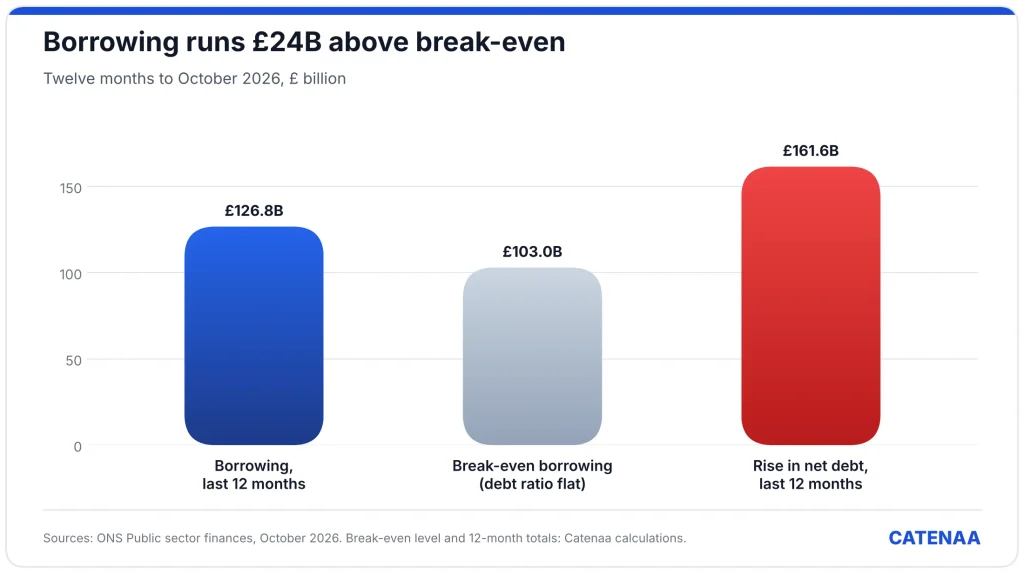
Catenaa estimates borrowing must fall to about £103 billion a year just to hold the debt ratio steady.
UK debt kept climbing in October, even as annual borrowing slowed. Public sector net debt hit £3,058.3 billion at the end of the month. The Office for National Statistics published the data on November 20. That equals 95.8% of GDP, a level last seen in the early 1960s. Moreover, debt rose £161.6 billion in a year.
October borrowing rose
The public sector borrowed £17.0 billion in October 2026. That was £0.8 billion, or 5.2%, more than a year earlier. It was also the third-highest October since monthly records began in 1993. Central government day-to-day spending rose by £7.0 billion. That was slightly more than the £6.7 billion rise in receipts, which income taxes led.
However, the full-year trend looks better. Borrowing from April to October reached £111.3 billion, down £7.3 billion on last year. Even so, that total ran £3.3 billion above the March forecast from the Office for Budget Responsibility.
Interest costs drive UK debt pressure
Debt interest explains much of the strain. Interest on central government debt hit £11.2 billion in October, up 33.4%. That was the highest October since records began in 1997. Index-linked gilts added £4.2 billion, after the Retail Prices Index rose 0.6% between July and August.
Over the year to date, interest reached £71.9 billion. By contrast, it took £67.0 billion in the same months last year. That equals about 65% of all borrowing so far this year. Put simply, interest now absorbs most of what the state borrows. Most of that borrowing flows through gilts sold by the Debt Management Office.
Why lower borrowing is not enough
Catenaa ran a simple test, using ONS figures, of whether the debt can hold steady. Over the past 12 months, the state borrowed £126.8 billion. Yet net debt rose £161.6 billion. Money lent out or spent on financial assets, which the deficit leaves out, largely fills that gap.
Next, compare interest with growth. Interest over that year came to £101.9 billion, an average rate near 3.4%. Meanwhile, nominal GDP grew about 3.5%, based on ONS debt ratios. With rates and growth roughly level, any deficit before interest pushes the ratio up. Excluding interest, the state still borrowed about £39 billion from April to October.
Consequently, holding debt at 95.8% of GDP needs annual borrowing near £103 billion, or 3.2% of GDP. Think of it as the break-even level for debt. Recent borrowing runs about £24 billion above that line. Hence the ratio keeps rising, even as borrowing falls.
Which debt measure counts?
Each UK debt measure tells a slightly different story. Net debt excluding the Bank of England stood at £2,925.5 billion. Net financial liabilities, the government’s fiscal target, reached £2,696.2 billion, or 84.5% of GDP. Revisions matter too, since the ONS cut its borrowing estimate for the year to September by £3.6 billion.
Bank of England effects add noise as well. Central government paid £13.3 billion this year into the fund that holds the Bank’s quantitative easing gilts. That payment leaves total public borrowing unchanged, however.
Readers can test these figures in the full ONS public sector finances dataset. Inflation-linked gilts, Bank of England effects and revisions all move the totals.
What to watch
The government’s rules target a surplus on day-to-day spending by March 2030. They also require net financial liabilities to fall as a share of GDP. So far, that ratio has risen, from 81.2% in March to 84.5% in October. Interest costs should ease if inflation cools and gilt yields fall. Also, the ONS will revise these early figures as fuller data arrive. Until then, slower deficits alone will not stabilise UK debt.