
June 03, 2026 – Bitcoin shed 22%, ETH fell 35%, and $15.7 billion was liquidated. Yet stablecoins and real-world assets set new records in the same quarter.
In Summary
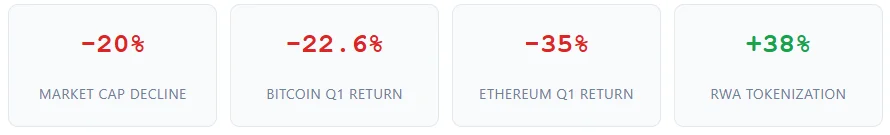
The total crypto market cap dropped nearly 20%, briefly falling below $2.5 trillion.
Bitcoin lost 22.6% during Q1, hitting $63,800 on February 6 for the first time since September 2024.
Ethereum fell 35% to $1,820, its lowest price since May 2025, while ETF flows remained persistently weak.
Crypto ETFs recorded $3.4 billion in net outflows. Meanwhile, corporate treasuries added $3.7 billion in crypto.
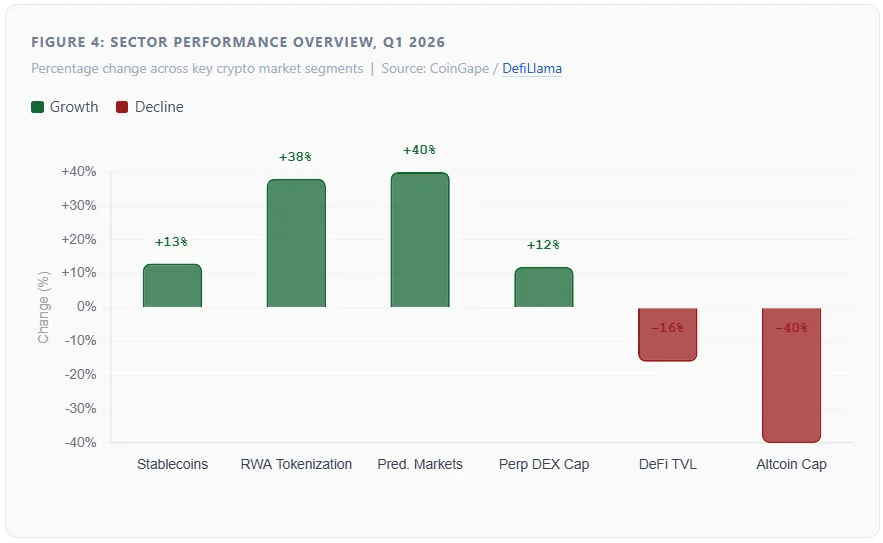
Stablecoins reached a record high of $316.4 billion. RWA tokenization grew 38%, surpassing $20 billion.
AI-driven agentic commerce processed a record 120 million transactions in Q1 2026.
The crypto market began Q1 2026 with strong momentum. However, it quickly became one of the most painful quarters since FTX’s 2022 collapse. According to CoinGape’s Q1 2026 Crypto Market Report, the total market cap fell nearly 20%. Briefly, it dropped below $2.5 trillion for the first time since November 2024. Over $15.7 billion in leveraged positions were liquidated. Yet not everything fell. Stablecoins, real-world assets, and AI-driven commerce showed impressive resilience throughout the downturn.
Bitcoin and Ethereum hit multi-month lows
Bitcoin’s sharp Q1 decline
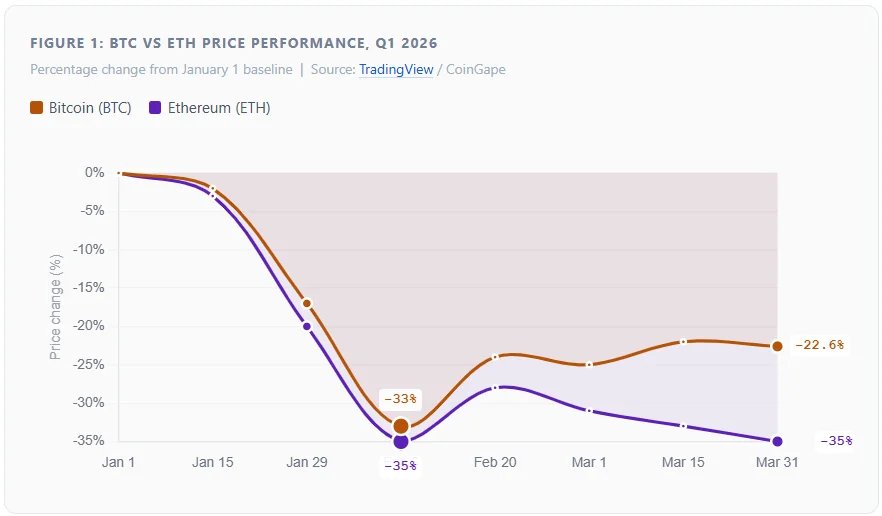
Bitcoin lost 22.6% during Q1 2026, its steepest quarterly drop in recent years. The selloff started on January 29 with a dramatic 15% single-day crash. BTC plunged from $96,000 to $80,000 in one session. Furthermore, hawkish Federal Reserve signals and geopolitical shocks deepened the decline through February. By February 6, Bitcoin had fallen below $64,000, its lowest point since September 2024. The Crypto Fear and Greed Index hit 6, matching its lowest reading since the 2022 FTX collapse.
A brief mid-February recovery pushed BTC back toward $70,000. Softer-than-expected CPI data provided the spark for that rally. However, U.S. military strikes on Iran halted the momentum. Bitcoin ended Q1 down 22.6%. By comparison, BTC gained 5% in Q1 2025 under far more favorable macro conditions.
Ethereum falls harder than Bitcoin
Ethereum’s decline was even steeper. ETH dropped 35%, hitting $1,820 on February 6. That was its lowest price since May 2025, down sharply from $2,800 at the start of the year. Weak ETF flows contributed significantly to the underperformance. BlackRock’s ETHA fund recorded a net outflow of 258,190 ETH during Q1. Despite the price drop, Ethereum retained over 56% of total DeFi TVL. Its stablecoin base remained steady at $164 billion, showing structural resilience beneath the surface. For comparison, ETH gained 12% in Q1 2025 on tailwinds from ETF approval.
Institutions diverge: ETFs sell, DATs buy
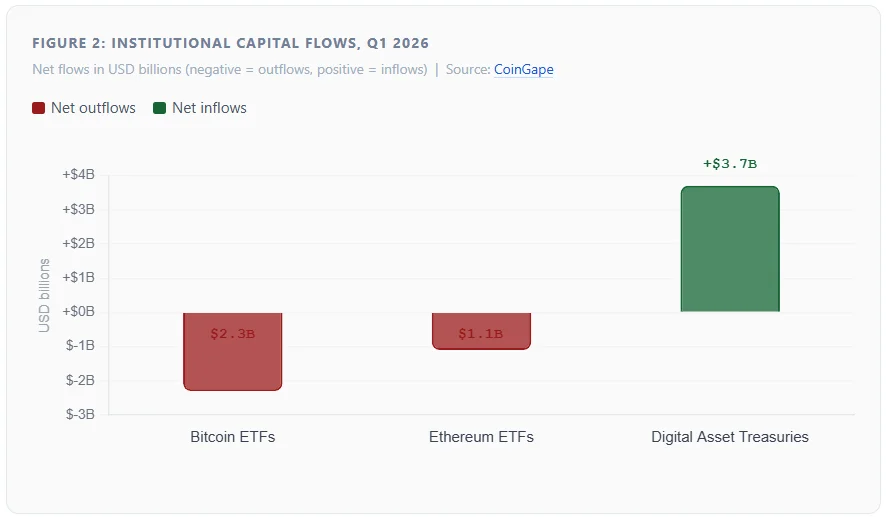
Q1 2026 revealed a sharp divide in institutional behavior. Crypto ETFs suffered heavy outflows. Meanwhile, corporate crypto treasuries bought aggressively throughout the quarter. This divergence defined one of Q1’s most important narratives.
Total ETF net outflows exceeded $3.4 billion, per CoinGape’s analysis. Bitcoin ETFs alone saw $2.3 billion in net selling. BlackRock’s IBIT reduced its BTC holdings from 770,791 to 761,655 coins by mid-February. The Bitcoin ETF arbitrage yield collapsed from 17% to below 5%. Consequently, hedge funds unwound their basis trade positions en masse, amplifying the sell-off.
In contrast, Digital Asset Treasuries (DATs) took the opposite approach. Public companies added over $3.7 billion in crypto to their balance sheets. Strategy bought 42,114 BTC in Q1 and now holds over 843,000 BTC in total. Bitmine Immersion acquired 179,946 ETH, making a significant long-term bet. By the end of Q1, US-traded companies held 5.42% of all circulating Bitcoin, 5.22% of Ethereum, and 2.95% of Solana.
“Hyperliquid Treasuries was the only profitable top Digital Asset Treasury in Q1 2026, as most DATs faced combined unrealized losses exceeding $7 billion.”
Altcoins collapse as retail exits
The altcoin market suffered much deeper losses than Bitcoin or Ethereum. Total altcoin market cap dropped approximately 40%, per TradingView market data. Altcoin dominance fell to just 12.45% on February 6, a multi-year low. Retail participation contracted sharply across most sectors.
Memecoins were hit hardest. Cat-themed tokens lost 58% of their market cap in a single day. Layer-2 tokens also declined sharply due to narrative fatigue. Optimism’s OP token fell 23% after Base announced a move away from OP Stack. Legacy AI tokens shed value as attention shifted toward newer agentic commerce projects. Privacy coins were volatile: Monero surged 82% before crashing 62% within the same quarter.
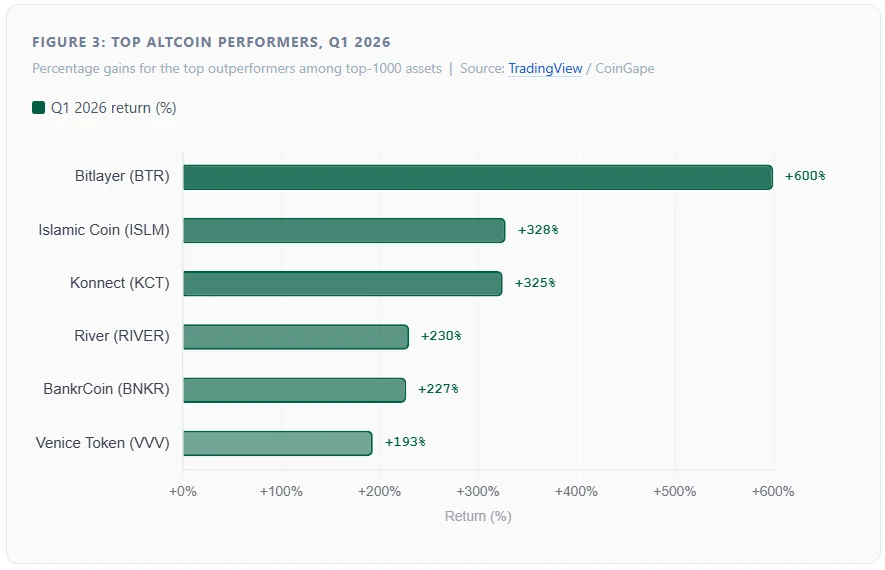
Nevertheless, a handful of assets bucked the trend strongly. Bitlayer ($BTR) surged 600%, becoming the best performer among the top 1,000 assets. Islamic Coin ($ISLM) gained 328%, and Konnect ($KCT) rose 325%. These gains reflected project-specific catalysts rather than any sector-wide recovery.
DeFi TVL falls 16%, exchanges slow down
DeFi total value locked (TVL) fell 16% during Q1 2026, per DefiLlama’s on-chain data. TVL dropped to $90 billion on February 6, the lowest since April 2025. However, protocol revenues held up better than TVL figures alone suggested. Hyperliquid generated over $180 million in fees and $161 million in revenue, making it the highest-revenue DeFi protocol of the quarter. TRON earned $67.33 million in fees, driven almost entirely by its stablecoin ecosystem.
Centralized exchange volume fell to $1.13 trillion in February, the lowest since September 2024. Binance maintained over 30% dominance in the spot market despite the slowdown. DEX volumes also dropped to $288 billion in February. However, PumpSwap reached a record $16 billion in monthly volume, up from just $1.5 billion in December. That represents more than a 10-fold increase in two months.
Stablecoins, RWAs, and AI set records
Despite broad market losses, several sectors posted record growth in Q1. Stablecoins reached an all-time high market cap of $316.4 billion. Monthly stablecoin transaction volumes surpassed $10 trillion for the first time ever. TRON hosted $86.82 billion in stablecoins, second only to Ethereum globally.
Real-world asset (RWA) tokenization grew 38%, surpassing $20 billion in total value. This growth reflected rising institutional demand for blockchain-based securities. Additionally, AI-driven agentic commerce processed a record 120 million transactions in Q1. These sectors together highlight crypto’s expanding utility well beyond speculation.
Prediction markets also set records
Monthly trading volume on Polymarket hit $338 billion in January 2026. Total value locked in prediction markets surpassed $560 million for the first time. Polymarket held 65.6% market share, with 606,000 monthly active users and 102,870 events on record, a 52% increase year-over-year.
Q2 2026 outlook: cautious optimism
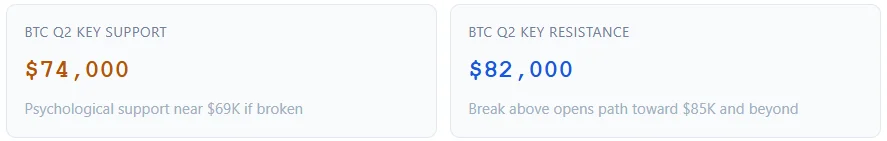
The path forward for Q2 2026 carries both risk and opportunity. Bitcoin currently trades near $77,500, with key support around $74,000. A sustained move above $82,000 could open the path toward $85,000. Strategy continues to buy BTC each week, providing consistent structural demand from corporate treasuries.
Moreover, Ethereum’s Glamsterdam upgrade, expected in Q3, aims to improve L1 efficiency and block building. The $2,000 support level remains critical for ETH bulls in the near term. Mixed ETF flows continue to weigh on sentiment for both assets.
Therefore, two factors will likely shape Q2 direction: macroeconomic liquidity and ETF flow trends. Consistent ETF inflows would signal a meaningful trend reversal. Furthermore, continued corporate accumulation adds durable structural demand. However, geopolitical risks and Fed policy uncertainty remain as significant headwinds. The quarter ahead will test whether Q1’s bright spots can ignite a broader recovery.