

November 09, 2026 – Central banks bought more gold than jewelry shoppers in the third quarter. Yet the price still sits about a quarter below its January record.

In Summary
Global gold demand totaled 1,369 tonnes in Q3 2026, worth about $188 billion.
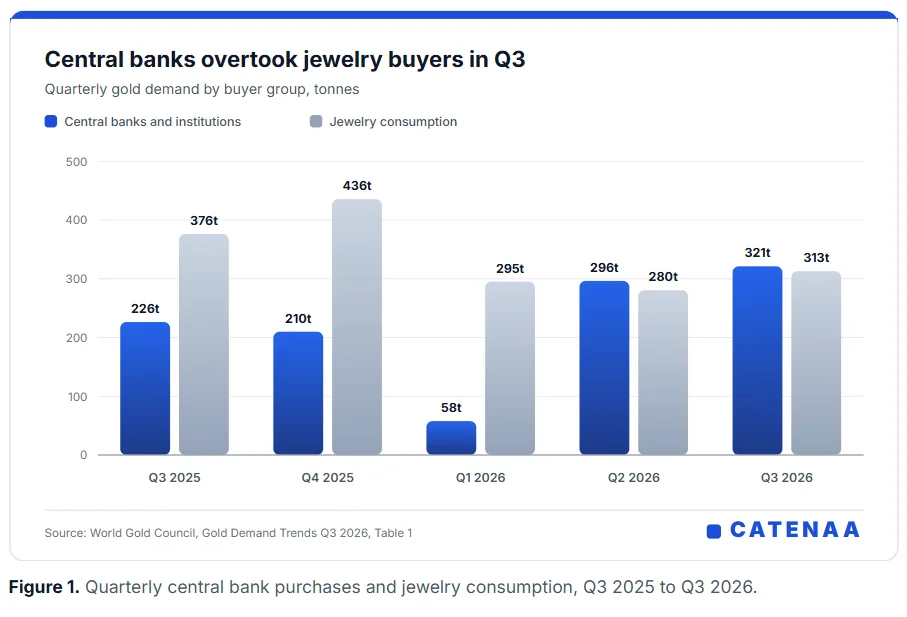
Central banks bought 321 tonnes, more than the 313 tonnes of jewelry demand.
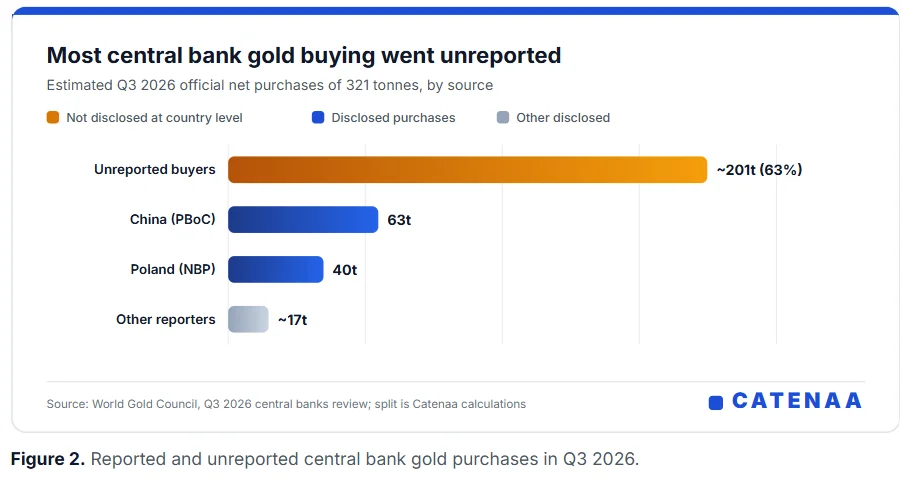
Roughly 63% of official buying did not appear in country-level reports.
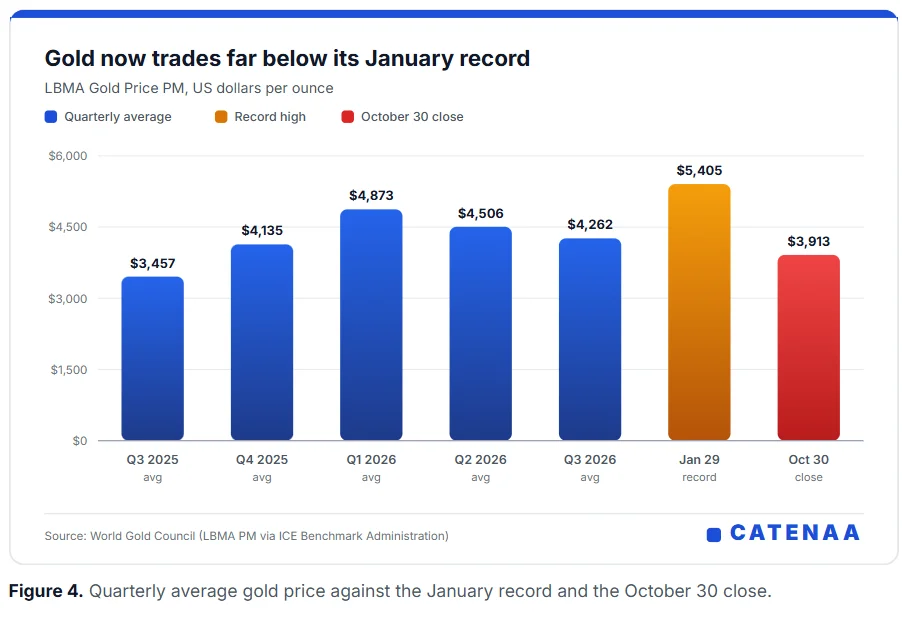
Gold closed October at $3,913 an ounce, 27.6% below its $5,405 record.
Gold demand held steady in the third quarter, but the price has slipped since. World Gold Council data show total demand of 1,369 tonnes, down just 1% from a year earlier. At the quarter’s average price, that metal was worth about $188 billion, up 22%.
Most of that gain came from price, not volume. The LBMA gold price averaged $4,262 an ounce in Q3, 23% above a year before. However, the market looks very different a few weeks later. Gold finished October at $3,913, according to the council’s October commentary. That leaves it 27.6% below its $5,405 record from January 29.
Gold demand tilts toward central banks
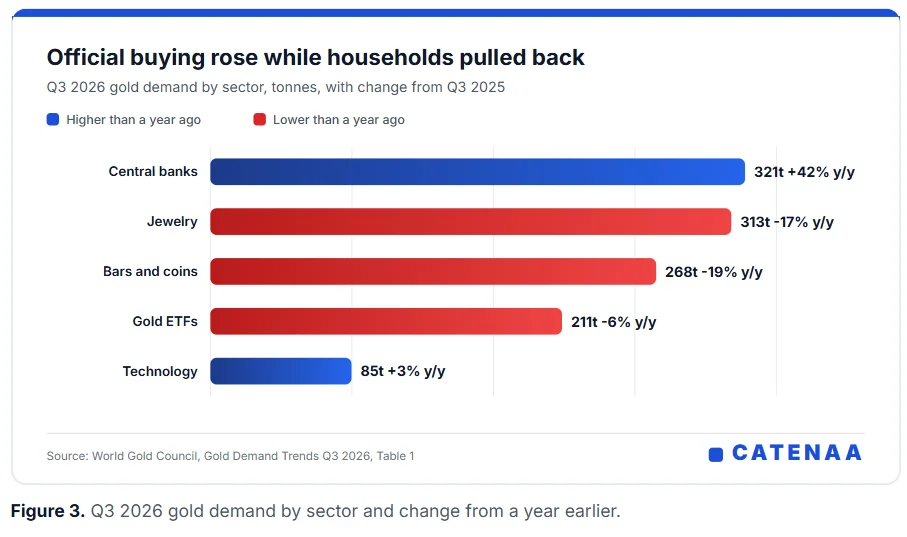
The biggest shift in gold demand sits in who is buying. Central banks and other official bodies added 321 tonnes, a 42% jump from a year earlier. Meanwhile, jewelry demand fell 17% to 313 tonnes, the weakest third quarter in the council’s records. As a result, official buyers took more gold than jewelry shoppers. A year ago, jewelry beat central bank buying by about 150 tonnes.
Official buying is also hard to trace. Only 120 tonnes showed up in country-level reports, the council’s central bank review notes. China added 63 tonnes and Poland 40 tonnes, together about 86% of the reported total. The rest, roughly 63% of the quarter’s demand, came from unreported sources. Year to date, central banks have bought 675 tonnes, 6% more than a year earlier.
Investors and households pull in opposite directions
Retail buyers turned cautious as prices swung. Bar and coin demand fell 19% to 268 tonnes. By contrast, gold-backed ETFs added 211 tonnes after outflows in the second quarter. That fund buying carried into October. Global gold ETFs drew $2.7 billion last month and lifted holdings by 19 tonnes to a record 4,275 tonnes. Still, their assets fell 6% to $542 billion because the price dropped.
North America was the only region with outflows, at $512 million. The council links part of that selling to stress in US tech shares. Some investors, it says, may have sold gold to raise cash. European funds, in contrast, added $1.8 billion, and Asian funds $1.3 billion.
Why the gold price is still falling
So why is gold weak when gold demand looks firm? The council points to three forces in October: Fed rate repricing, speculative de-grossing and a rotation into bonds. Net managed money positions on COMEX fell by $7 billion, or 53 tonnes. In other words, much of the selling may have come from futures, not physical buyers.
The council’s own floor test offers some hope. Its framework tracks three signals: a deep discount to trend, a strong dollar and a positioning washout. Two of the three are in place now. Positioning, however, remains high. Historically, all three together came before higher prices three months later, though that sample had only five cases.
What reserve managers expect next
Longer term, reserve managers still lean toward gold. In the council’s 2026 survey of 76 central banks, 74% expect lower dollar holdings in global reserves within five years. Moreover, a record 45% expect their own gold reserves to rise over the next year. Half said they would fund new purchases through domestic programs in local currency.
For now, the market sits between two stories. PAX Gold, a token backed by one troy ounce, closed November 7 at $4,060 on Kraken. That is about 25% below the January record. Next, traders will watch whether official gold demand can absorb the next wave of futures selling.