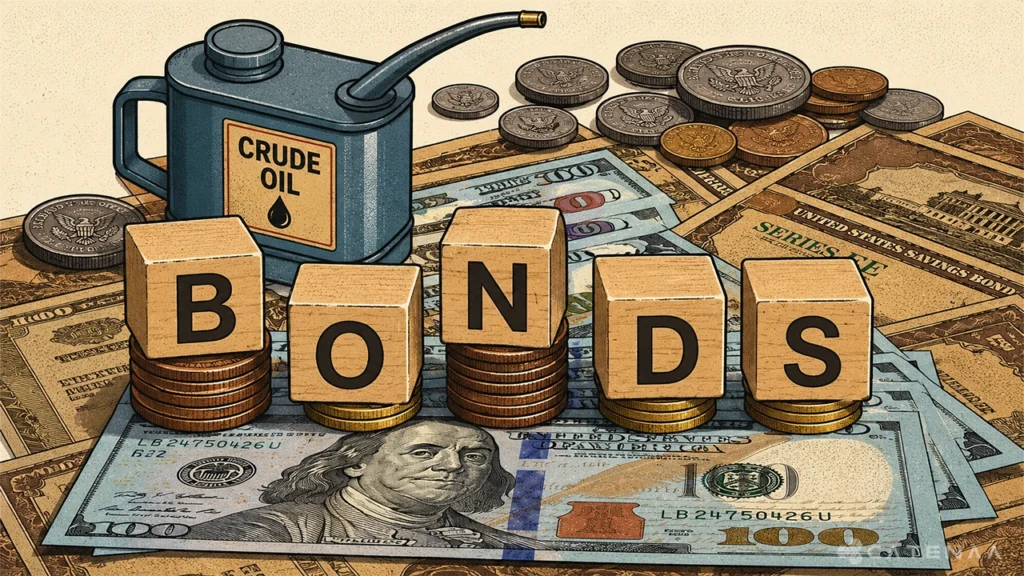


August 19, 2026 – The 30 year Treasury yield closed at 5.31%, its highest of the year, as crude climbed and the Federal Reserve stayed on hold.

In Summary
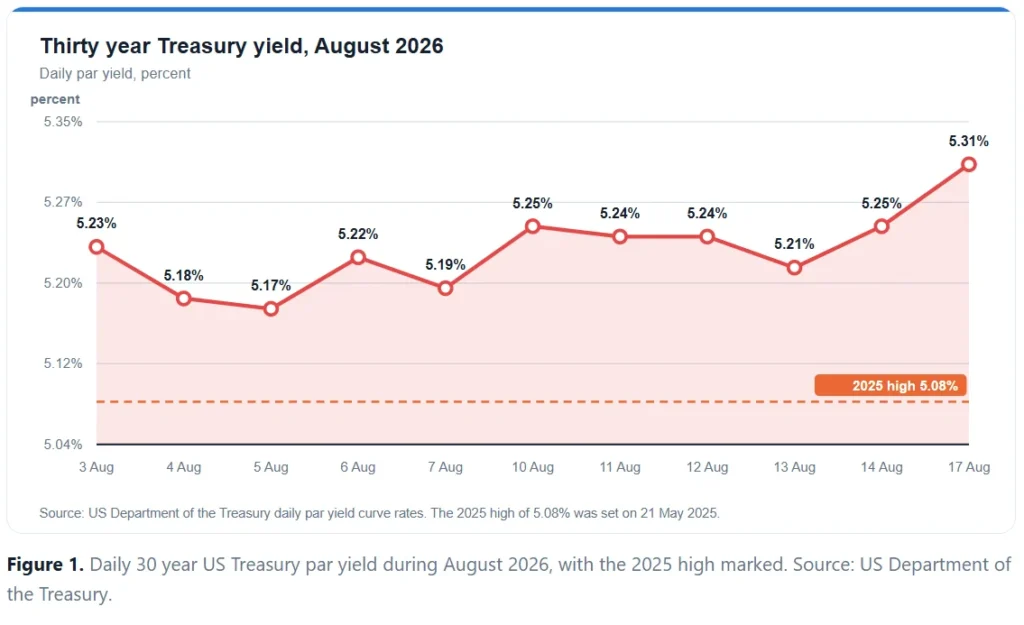
The 30-year US Treasury par yield closed at 5.31% on 17 August, the highest of 2026.
During all of 2025, the same yield never closed above 5.08%.
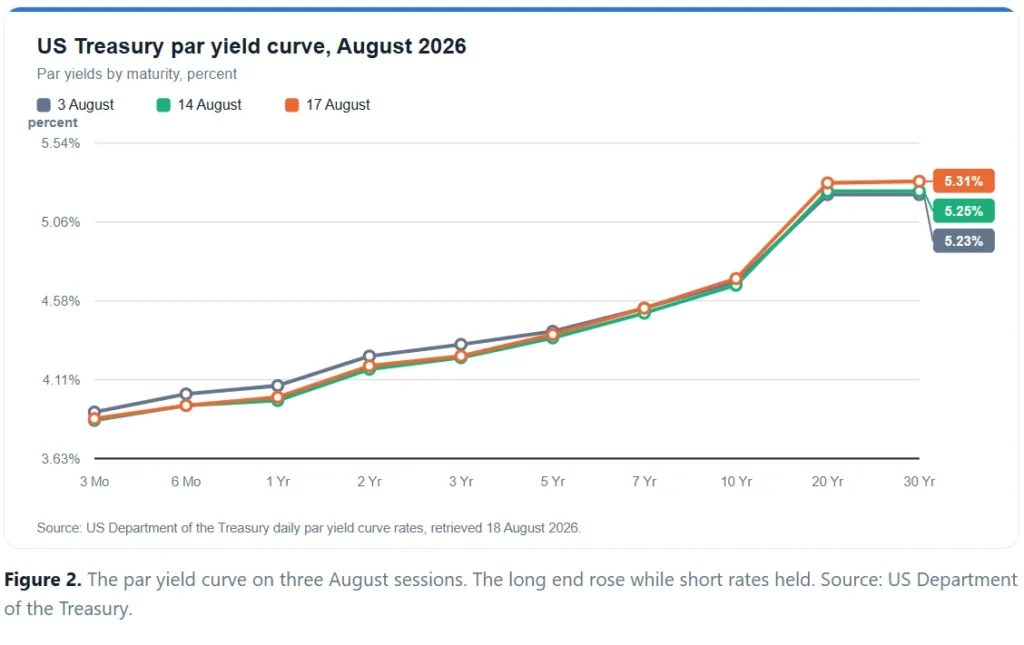
Short rates barely moved, so the curve steepened by 112 basis points between two and 30 years.
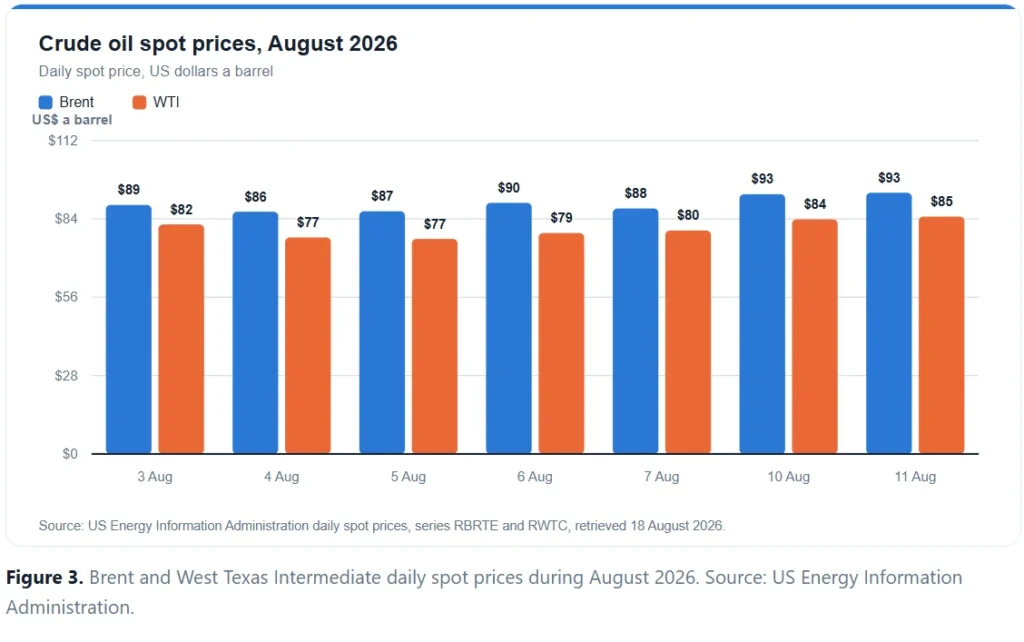
Brent spot rose from $86.47 on 4 August to $93.26 on 11 August, a gain of 7.9%.
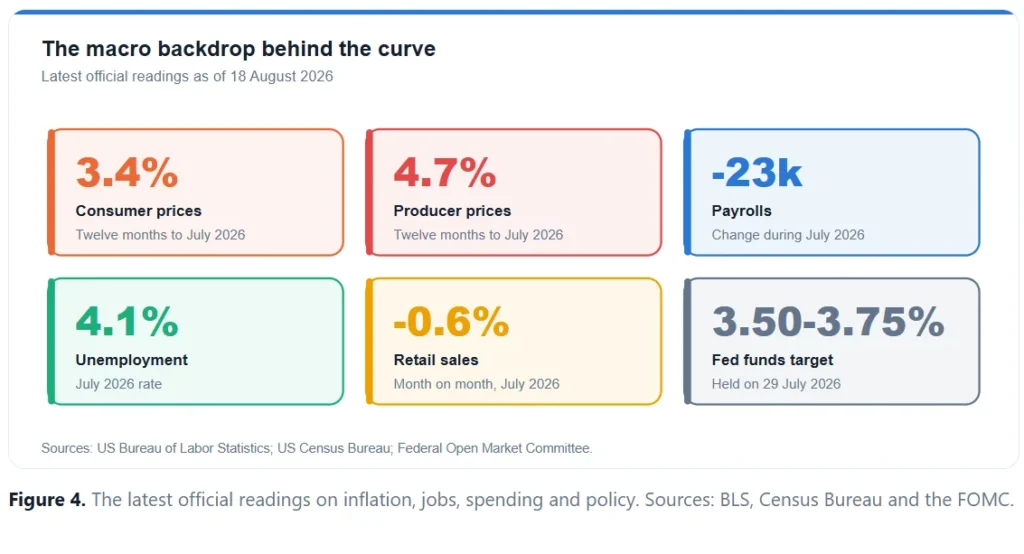
Annual consumer inflation held at 3.4% while producer prices ran at 4.7%.
Federal Reserve minutes arrive on 19 August, one day after the July housing starts release.
Long-dated US bond yields hit a fresh 2026 high on Monday, 17 August. The 30 year par yield closed at 5.31%, Treasury data show. That level beat every session of the year so far.
Moreover, it towered over 2025. Throughout that whole year, the 30-year yield never closed above 5.08%.
Twenty-year paper matched the move at 5.30%. Meanwhile, the 10-year rose to 4.72% and the two-year edged up to 4.19%.

Why bond yields keep climbing at the long end
Short rates barely budged. Three-month bills held at 3.87%, while one-year paper sat at 4.00%. So the pressure landed squarely on the far end of the curve.
That pattern produces a steeper slope. Indeed, the gap between two- and 30-year yields widened to 112 basis points on 17 August. On 3 August, it measured just 98 points.
Steepening usually signals two worries. Investors either demand more compensation for inflation, or they want more term premium for supply. Right now, though, both stories look plausible.
Auction size adds a third worry. Because deficits stay wide, dealers expect a heavy long bond supply into the autumn.
Oil supplies half of the inflation story
Crude has climbed hard through August. Brent spot averaged $93.26 on 11 August, according to Energy Information Administration data. Earlier in the month, it traded at $86.47.
West Texas Intermediate followed the same path. It moved from $77.33 on 4 August to $84.77 on 11 August. In percentage terms, therefore, that marks a 9.6% jump within a week.
Inventories offered little comfort. Commercial crude stocks reached 424.4m barrels in the week to 7 August. Even after a 17.4m barrel build, they sat about 2% below the five-year average.
Refiners ran hot as well. Utilization touched 96.2%, which leaves little slack for any supply shock.
The inflation numbers are still uncomfortable
Headline consumer prices rose 0.1% in July. Over twelve months, however, they gained 3.4%. Core prices climbed 2.5% on the same basis.
Producer prices tell a harsher story. Final demand held flat in July, yet the annual rate reached 4.7%. Similarly, core producer prices matched that pace.
Energy explains much of the gap. Consumer energy costs fell 1.5% during July, but they still stood 14.7% higher than a year earlier.
For bondholders, therefore, the annual figures matter more than the monthly ones. Twelve-month inflation has stayed above target all year.
Growth data points the other way
The labour market has cooled sharply. Payrolls fell 23,000 in July, while revisions stripped 103,000 jobs from May and June. Unemployment then held at 4.1%.
Consumers pulled back too. Retail and food services sales slipped 0.6% in July to $763.6bn. Meanwhile, sales excluding motor vehicles fell 0.3%.
Yet the annual comparison stays firm. Retail sales still ran 5.0% above July 2025.
This mix leaves the Federal Reserve stuck. Weak jobs argue for cuts, whereas sticky inflation argues against them.
The Fed holds while the market argues
Policymakers left the target range at 3.50% to 3.75% on 29 July. That decision marked a fifth consecutive hold.
The vote split badly, however. Three governors wanted a quarter-point increase, and nine did not. Such a wide split rarely settles quickly.
Minutes from that meeting arrived on 19 August. Traders will therefore hunt for the inflation language behind the dissent.
Housing data lands on Tuesday
The Census Bureau publishes July housing starts on 18 August. June set a high bar at 1,427,000 units on a seasonally adjusted annual rate. That figure jumped 19.0% from May.
Permits looked steadier at 1,367,000. Completions, in turn, reached 1,392,000.
Higher long yields complicate the picture. Because mortgage pricing tracks the long end, a 5.31% 30-year rate pushes home loans higher.
Builders therefore face a squeeze. Demand cools exactly when their financing costs rise. In short, the sector reacts to the curve faster than most.
What comes next for bond yields
Three catalysts sit within days. The housing print lands first, then the Fed minutes, and finally any fresh move in crude.
Central banks add a slower undercurrent. Official gold buying reached 289 tonnes in the second quarter, up 62% from a year earlier. Clearly, reserve managers want less exposure to long-duration paper.
Currency markets watch the same signal. Since a steeper curve usually lifts the dollar, importers of energy face a double squeeze.
For now, the curve keeps steepening. Until inflation cools or oil retreats, the long end looks unlikely to rally.