

September 21, 2026 – The Dow lost 890.65 points in the week to 18 September while the Nasdaq rose. One stock, Goldman Sachs, accounted for well over half of the drop.

In Summary
The Dow Jones fell 1.69%, or 890.65 points, in the week to 18 September, its worst week since March.
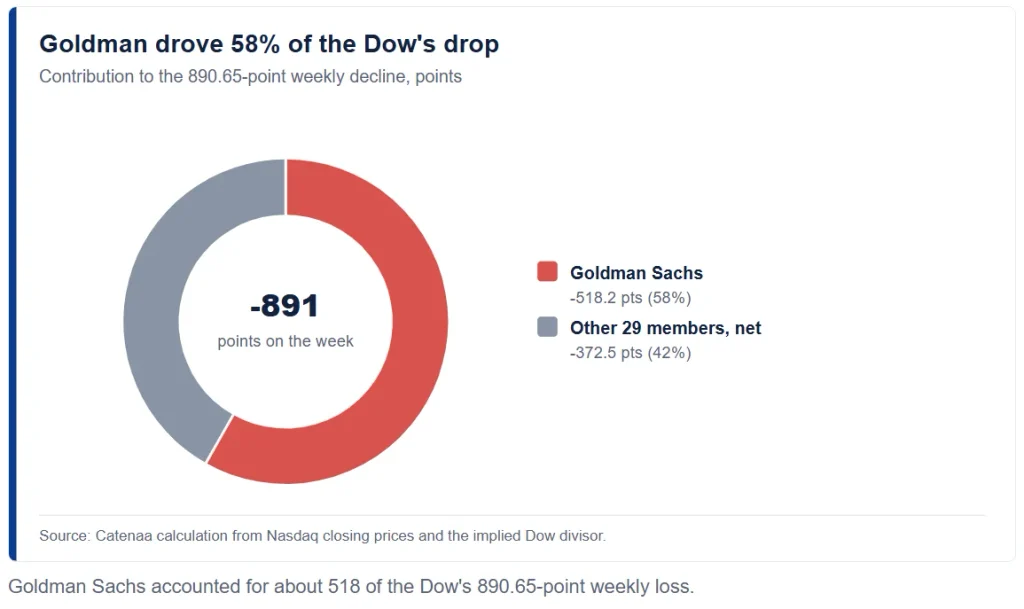
Goldman Sachs dropped 8.47% and cost the price-weighted index about 518 points, roughly 58% of the loss.
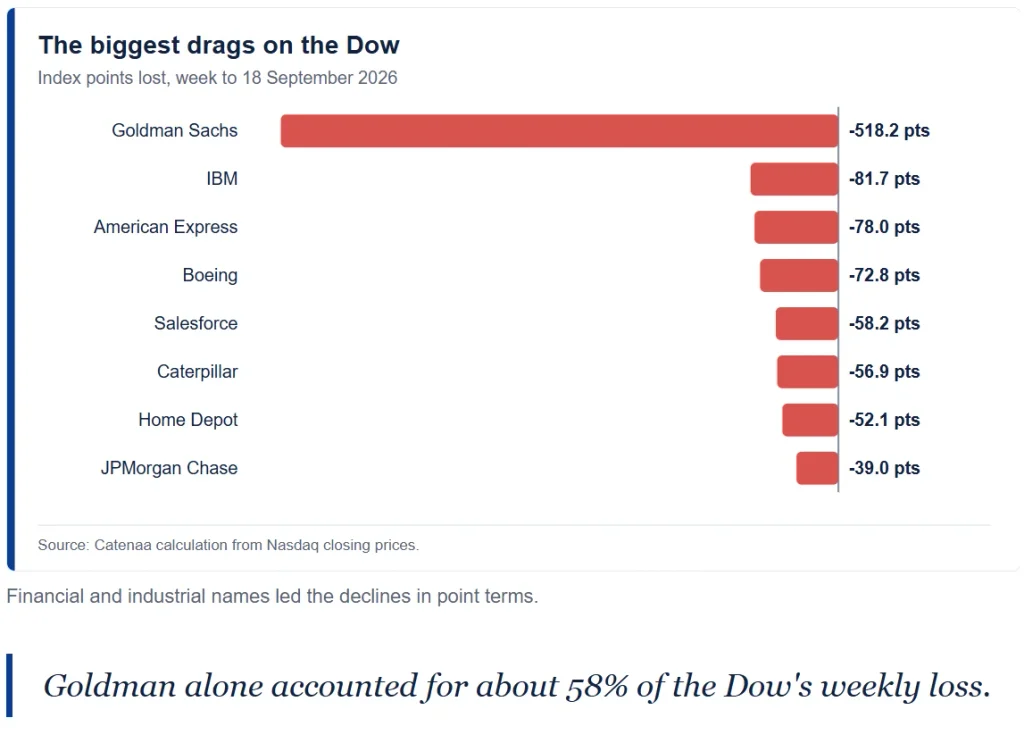
IBM, American Express, Boeing and Salesforce were the next largest drags.
The Nasdaq Composite rose 0.72%, helped by gains in Alphabet, Nvidia and Apple.
The 10-year Treasury yield rose to 5.01% after the Fed’s 16 September hike.
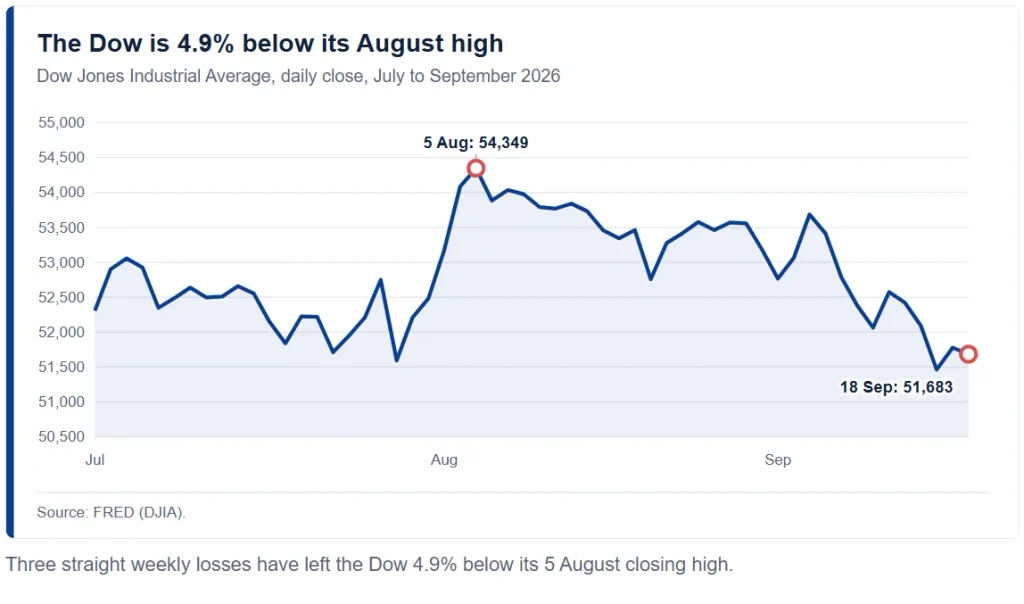
The Dow Jones Industrial Average just had its worst week since March. The blue-chip index fell 1.69% in the week to 18 September, closing at 51,682.64, index data show. That was a drop of 890.65 points, and the third weekly loss in a row. Across those three weeks, the Dow Jones has shed about 3.5%.
Yet the broader market barely moved. The Nasdaq Composite rose 0.72% over the same week. The S&P 500 slipped less than 0.1%. So what went wrong for the Dow?
One Stock Drove the Dow Jones Drop
The answer is mostly one stock. Goldman Sachs fell 8.47% on the week, from $1,029.18 to $942.00, Nasdaq trading data show. Because the Dow weights stocks by price, Goldman carries more influence than any other member.
By Catenaa’s calculation, Goldman alone knocked about 518 points off the index. That equals roughly 58% of the Dow’s entire weekly decline. No other stock came close. Goldman’s share price now makes up about 10.8% of the sum of all 30 member prices.
The selling came in waves. Goldman fell 3.96% on Monday, 14 September, and slipped below $1,000. It then dropped another 3.96% on Wednesday, the day of the Fed decision. A small rebound on Thursday did not last.
The maths is simple. The Dow adds up the share prices of its 30 members and divides by a fixed divisor. Based on this week’s closes, that divisor sits near 0.168. Therefore, each $1 move in any member shifts the index by about 5.9 points.
Market-value indices work differently. The S&P 500 gives the largest companies the biggest say, so it closed at 7,650.50, almost flat. Price weighting, by contrast, ignores company size. A $10 move in a $942 stock counts the same as a $10 move in a $36 stock.
Financials and Industrials Weighed
Other heavyweights added to the pain. IBM fell 5.65%, taking about 82 points off the Dow. American Express dropped 4.04%, costing about 78 points. Boeing slid 5.82%, which removed nearly 73 points more.
Salesforce lost 3.96%, while Caterpillar fell only 1.17%. Even so, Caterpillar’s high share price turned that small move into a 57-point hit. JPMorgan Chase, meanwhile, eased 1.84%. Microsoft, the third-highest priced member, dipped just 0.37%.
Bank shares struggled across the board. Bank of America, which is not in the Dow, fell 7.9% on the week. That pattern points to sector-wide pressure on lenders rather than a single company problem.
Tech Names Held the Line
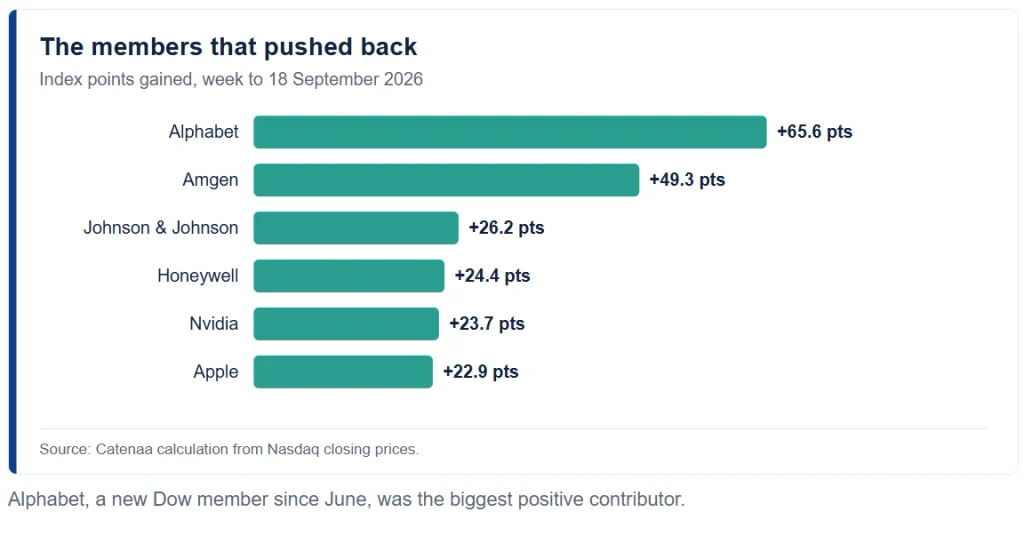
A few members pushed back. Alphabet gained 3.26%, adding about 66 points. Amgen rose 2.2%, and Johnson & Johnson gained 1.66%. Honeywell, Nvidia and Apple also finished higher.
Alphabet’s role is new. It joined the index in June, replacing Verizon. That change gave the Dow more exposure to large technology stocks. This week, it helped offset some of the damage from financials.
Tech strength also explains the gap with the Nasdaq. The Composite closed at 26,522.55, lifted by the same large technology names. The Dow, by contrast, leans more on banks and industrial firms.
Higher Yields Set the Backdrop
Rates remained the key macro force. The Federal Reserve raised its target range to 3.75% to 4.00% on 16 September. Bond yields climbed through the week.
The daily pattern shows how the Fed shaped the week. The Dow closed at 52,421.20 on Monday and 52,093.11 on Tuesday. It hit its weekly low of 51,461.90 on Wednesday, after the rate decision. It then recovered to 51,778.04 on Thursday before slipping on Friday.
The 10-year Treasury yield ended at 5.01% on 18 September, up from 4.96% a week earlier, Treasury data show. The two-year yield rose further, from 4.63% to 4.76%. Rising yields lift funding costs and can weigh on stock valuations.
What the Dow Jones Slide Means
The Dow now sits 4.9% below its 2026 closing high of 54,349.12, set on 5 August. It is still up about 7.5% this year. The Nasdaq, meanwhile, has gained about 14.1% since the end of 2025.
For investors, the lesson is about index design. A price-weighted average can swing sharply on one expensive stock. In this case, Goldman’s slide made the market look weaker than it was.
Next, attention turns to third-quarter bank earnings in October. Those results will show whether the sell-off in financials went too far. Until then, the Dow Jones may stay more sensitive to bank news than the broader market.