

November 15, 2026 – Wholesale costs are rising much faster than shelf prices. Catenaa’s pass-through matrix shows which sectors are absorbing the gap.

In Summary
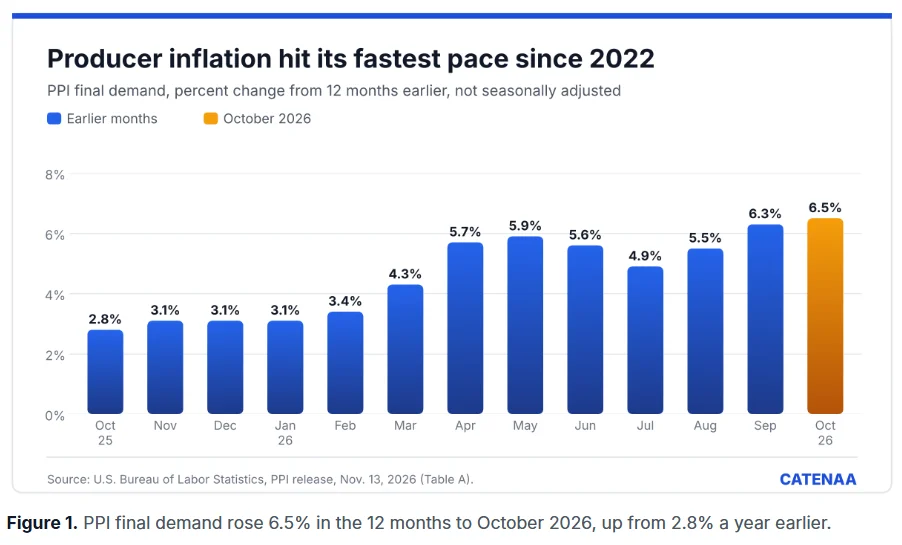
Producer prices for final demand rose 6.5% in the 12 months to October, the fastest pace since November 2022.
Goods prices at the producer level climbed 10.2%, led by a 37% jump in final demand energy.
Producer costs outran consumer prices in energy, transport and core goods since November 2025.
Food is the exception, where consumer prices rose faster. Services were roughly in line.
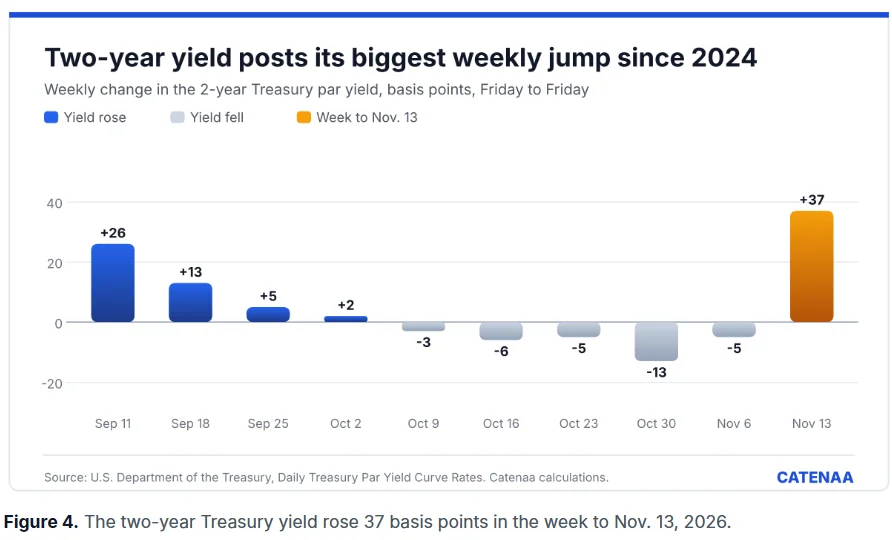
The two-year Treasury yield jumped 37 basis points in the week to Nov. 13.
US producer prices are rising at their fastest pace in nearly four years. The Bureau of Labor Statistics said its final demand index rose 6.5% in the 12 months to October. That is the biggest gain since November 2022. Consumer prices are climbing too, but more slowly. That gap matters for company margins.
Producer prices: what October showed
The index rose 0.3% in October on a seasonally adjusted basis. That followed a 1.4% jump in September. Goods led the way, with prices up 0.5% for the month and 10.2% for the year.
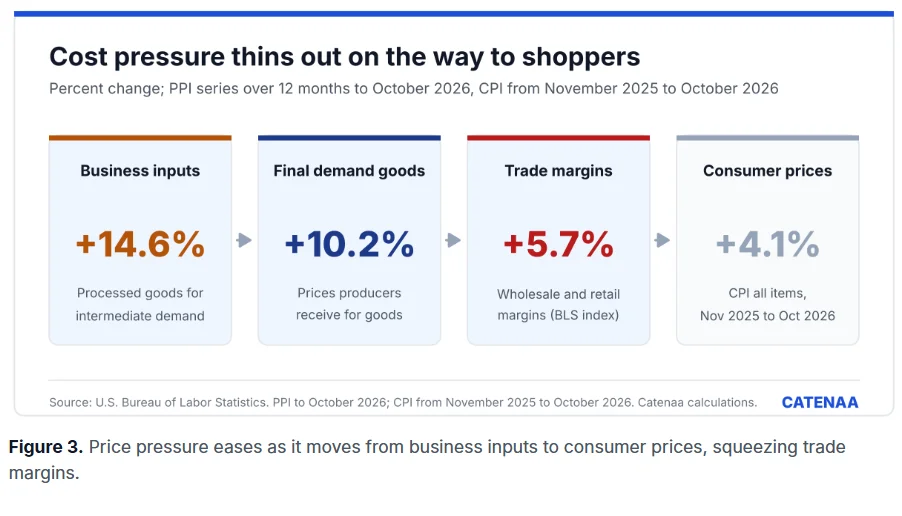
A core gauge that strips out food, energy and trade rose 4.9% over the year. Energy, however, drove much of the goods rise. Catenaa’s calculations from BLS index data show final demand energy prices up 37% from a year earlier. Moreover, prices for processed goods that firms buy from each other rose 14.6%. That points to more cost pressure in the pipeline.
Services rose for a fifth straight month. Transport and warehousing prices climbed 2.0% in October alone. Truck freight rates rose 3.9%. On the other hand, diesel fuel prices fell 7.9%, which may ease some freight costs.
Consumers are paying less of the bill
The consumer price index rose 0.4% in October, after a 0.6% gain in September. However, BLS could not publish most 12-month CPI rates for October. It did not collect data in October 2025 during a funding lapse, as its missing-data note explains.
To get around this, Catenaa compared both indexes from November 2025 to October 2026. Over that span, producer prices rose 6.4%. Consumer prices rose 4.1%. Core consumer prices, which exclude food and energy, rose 0.3% in October for a third straight month. Gasoline was one of the few 12-month rates BLS could publish. It stood 37.4% higher than a year earlier.
Catenaa’s pass-through matrix
We matched five producer categories with their closest consumer categories. The results show where firms are absorbing costs. The categories do not match one for one, so the gaps are a guide, not a precise margin gauge.
Energy shows a wide gap. Producer energy prices rose 34.7%, while consumer energy prices rose 21.6%. Transport is even more stretched. Producer transport prices rose 18.5%, yet consumer transport service prices rose only 4.0%.
Core goods follow the same pattern, at 5.0% versus 1.4%. Services, by contrast, look balanced. Producer service prices rose 3.2%, close to the 3.3% rise for consumers.
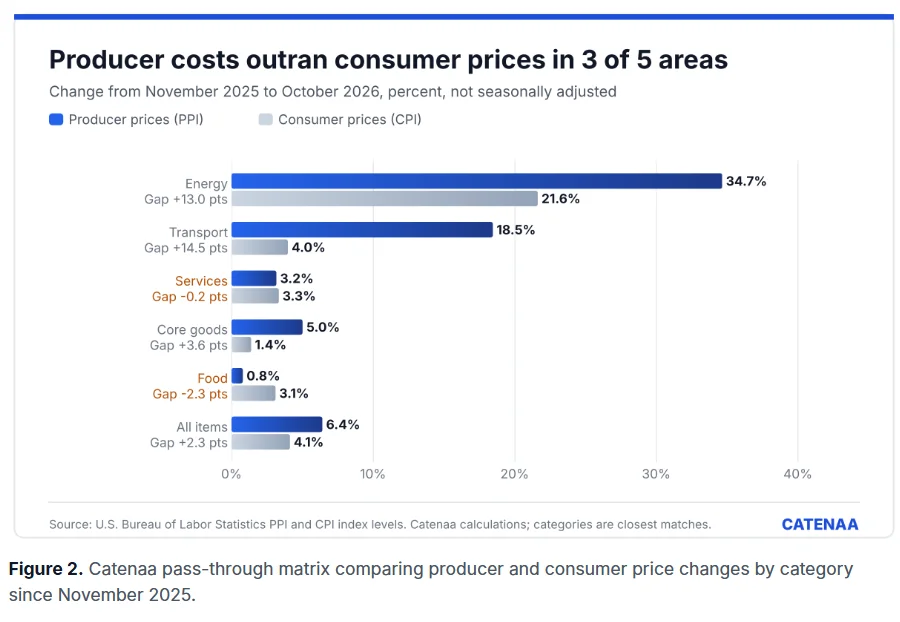
Food is the outlier. Producer food prices rose just 0.8%, but consumer food prices rose 3.1%. Food sellers, therefore, appear to hold more pricing power for now.
There is one more warning sign. BLS trade indexes track the margins of wholesalers and retailers. Those margins rose 5.7% over the year, well below the 10.2% rise in goods prices. They also fell 0.2% in October.
Bond markets react fast
Investors moved quickly. The two-year Treasury yield rose from 4.51% on Nov. 6 to 4.88% on Nov. 13. That 37 basis point jump was the largest weekly gain since early October 2024. Meanwhile, the 10-year yield rose 29 basis points to 5.15%.
For businesses, the message is clear. Producer prices are climbing faster than many firms can pass on. Transport-heavy and goods-heavy sectors face the most pressure, while food sellers look better placed. Catenaa will update the matrix when November data arrive on the BLS release calendar.