


September 25, 2026 – Business activity grew at the fastest pace in more than five years in September. Input costs rose the most since 2022, and bond yields jumped.

In Summary
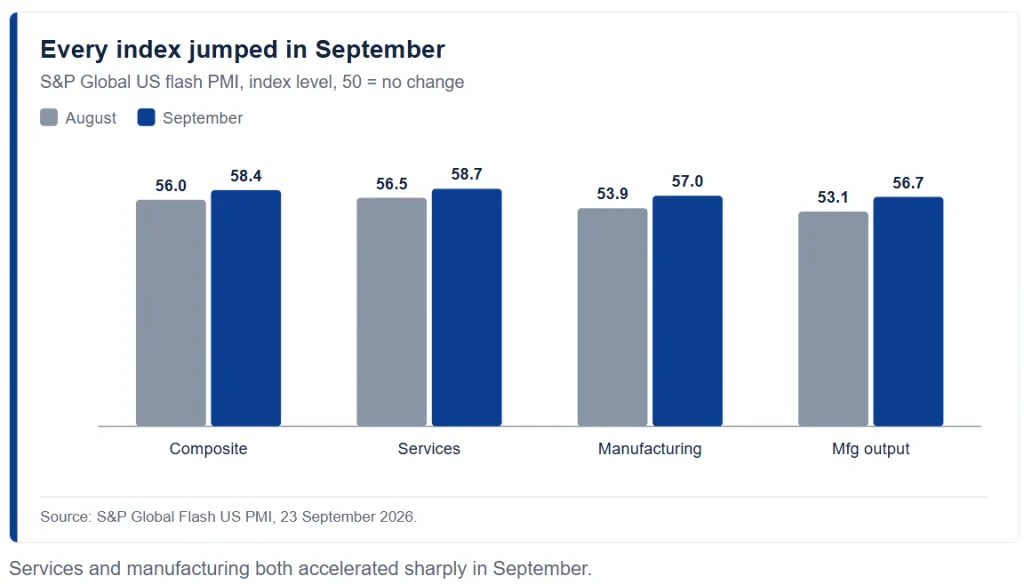
The US flash composite output index rose to 58.4 in September from 56.0, a 62-month high.
Services reached 58.7 and manufacturing 57.0, the strongest readings in 59 and 52 months.
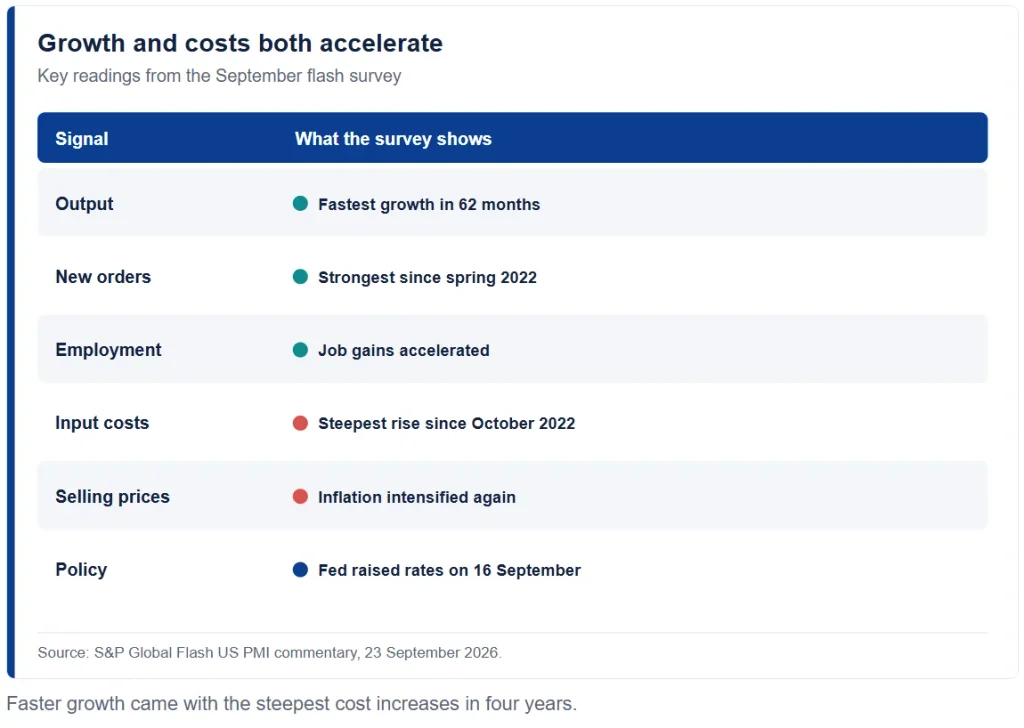
Input costs rose at the steepest rate since October 2022, and selling prices climbed too.
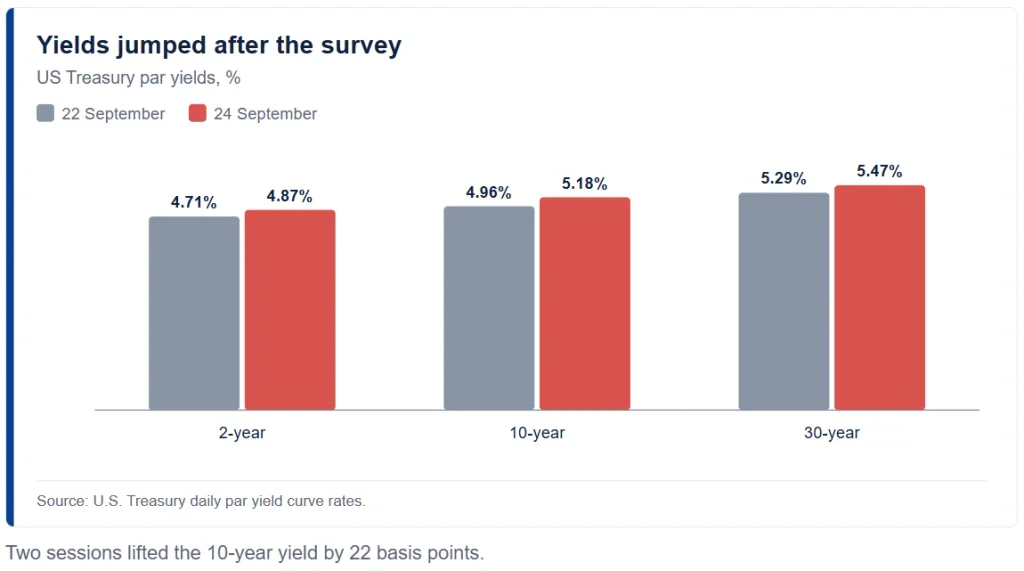
The 10-year Treasury yield rose from 4.96% to 5.18% in two sessions after the release.
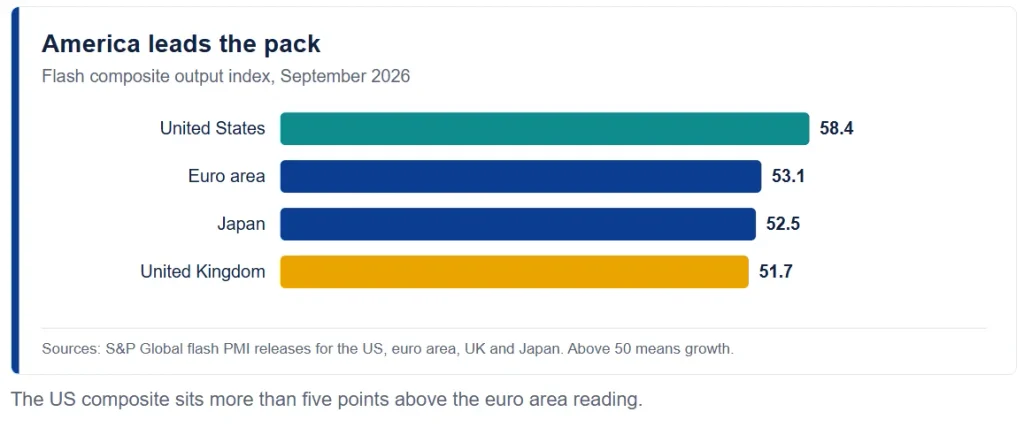
The euro area composite reached 53.1, while the UK slipped to 51.7 and Japan eased to 52.5.
American business activity is growing at its fastest pace in five years. The US flash PMI composite output index rose to 58.4 in September from 56.0 in August, S&P Global reported. That marks a 62-month high.
Bond markets reacted fast. The 10-year Treasury yield jumped to 5.11% on the day of the release, Treasury data show. It then climbed to 5.18% on 24 September, up from 4.96% before the survey.
What the US Flash PMI Showed
The US flash PMI covers about 85% of survey responses each month. Both halves of the economy accelerated this time. Services activity rose to 58.7, a 59-month high. Manufacturing climbed to 57.0, the strongest reading in 52 months.
Factory output also picked up sharply. The manufacturing output index reached 56.7 against 53.1 in August. New orders grew at the fastest pace since spring 2022 in both sectors.
Chris Williamson, chief business economist at S&P Global Market Intelligence, summed it up bluntly. “US business continues to boom, with output growing at the fastest rate for over five years in September,” he said.
Prices Are the Catch
Costs tell a less comfortable story. Input prices rose at the steepest rate since October 2022. Selling price inflation picked up as well.
Williamson flagged that risk directly. Firms’ input costs “jumped in September at the steepest rate for four years,” he noted. Companies are therefore passing more of those costs to customers.
That matters for policy. The Federal Reserve raised its target range to 3.75% to 4.00% on 16 September by a unanimous vote. Strong growth plus hotter costs weakens any case for cuts.
A US flash PMI this strong makes a pause harder to justify. The Fed said activity was expanding at a solid pace when it raised rates. Consequently, this survey supports that view and then some.
Yields Repriced Across the Curve
Rates rose across the curve. Two-year yields reached 4.87% on 24 September, up from 4.71% two days earlier. At the long end, the 30-year yield climbed to 5.47% from 5.29%.
Those are large moves for two sessions. Higher long yields raise borrowing costs for companies and households alike. They also pressure equity valuations, especially for growth stocks.
Equities felt it quickly. The S&P 500 slipped on both 23 and 24 September, after setting a Nasdaq record earlier in the week. Our report on that record close covers the earlier rally.
America Pulls Away From Its Peers
The global picture looks uneven. The euro area composite index reached 53.1 in September, its own flash survey shows. That was the best reading in almost three and a half years, yet far below the US level.
Britain went the other way. The UK composite slipped to 51.7 from 52.5, according to the flash survey. Japan’s composite eased to 52.5 from 53.5.
So the United States now leads the developed world by a wide margin. A gap of more than five points against the euro area is unusual. Currency and rate markets tend to follow such divergence.
That gap shapes policy too. European and Japanese central bankers face softer demand at home. American officials, by contrast, must judge whether a boom is rekindling inflation.
Why the Boom Is Happening Now
Several forces point the same way. Artificial intelligence investment continues to drive orders for equipment and services. Firms also report restocking and stronger domestic demand.
However, the survey carries warnings. Cost pressures reflect tariffs, energy prices and wages. Companies that cannot pass on costs will see margins shrink.
Employment is rising as well, which adds to wage pressure. Furthermore, strong hiring complicates the inflation outlook that the Fed must weigh.
Survey data can also overstate turning points. PMI readings measure breadth, not size, so a small firm counts as much as a large one. Analysts therefore treat one month as a signal, not proof.
What Comes Next for Markets
Three things deserve attention. First, watch whether the final September survey confirms the flash estimate. Revisions of a point or more do happen.
Second, watch inflation data. The Fed’s preferred gauge and the next consumer price report will test the survey’s price signals. Third, watch the long end of the curve. A sustained move above 5.2% on the 10-year would tighten conditions further.
For investors, two signals now pull in opposite directions. Growth looks strong, which supports earnings. Yet with the 10-year yield above 5%, the cost of that growth keeps rising.