

November 22, 2026 – BLS data show statistically significant job growth in just four states. That concentration matters for regional spending, lending and credit quality.

In Summary
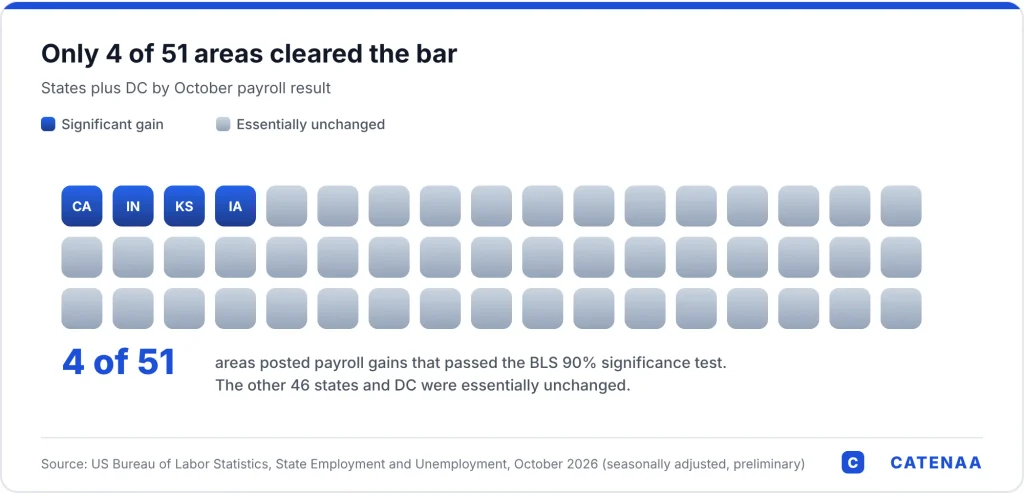
Only California, Indiana, Kansas and Iowa posted statistically significant payroll gains in October 2026.
Payrolls were essentially unchanged in 46 states and DC. The national jobless rate stood at 4.1%.
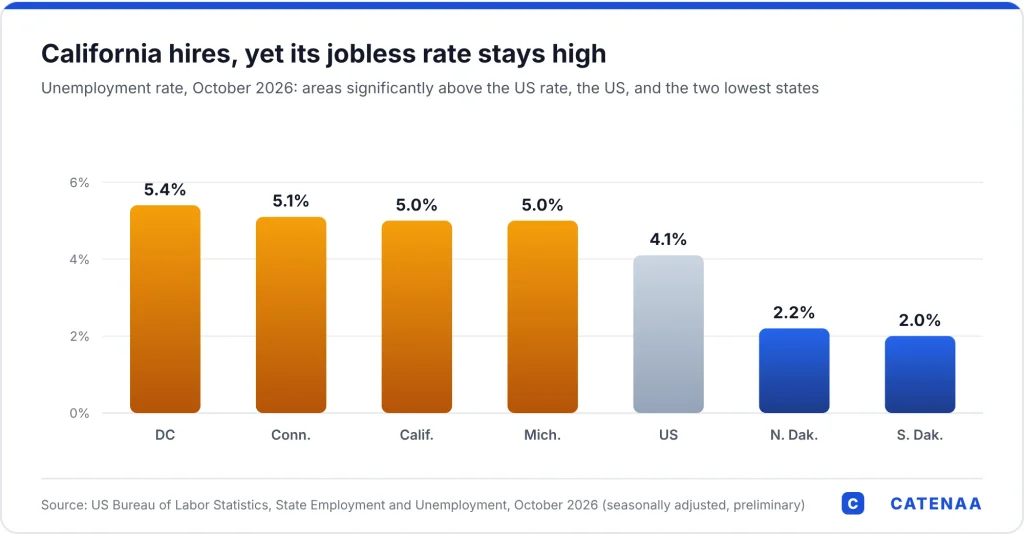
California added 47,100 jobs, yet its 5.0% unemployment rate sits significantly above the national level.
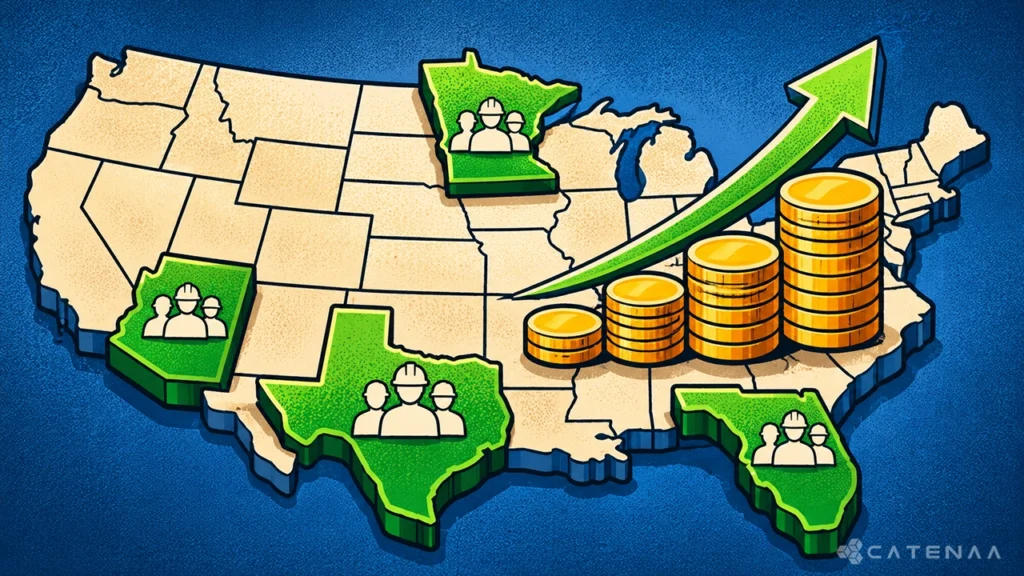
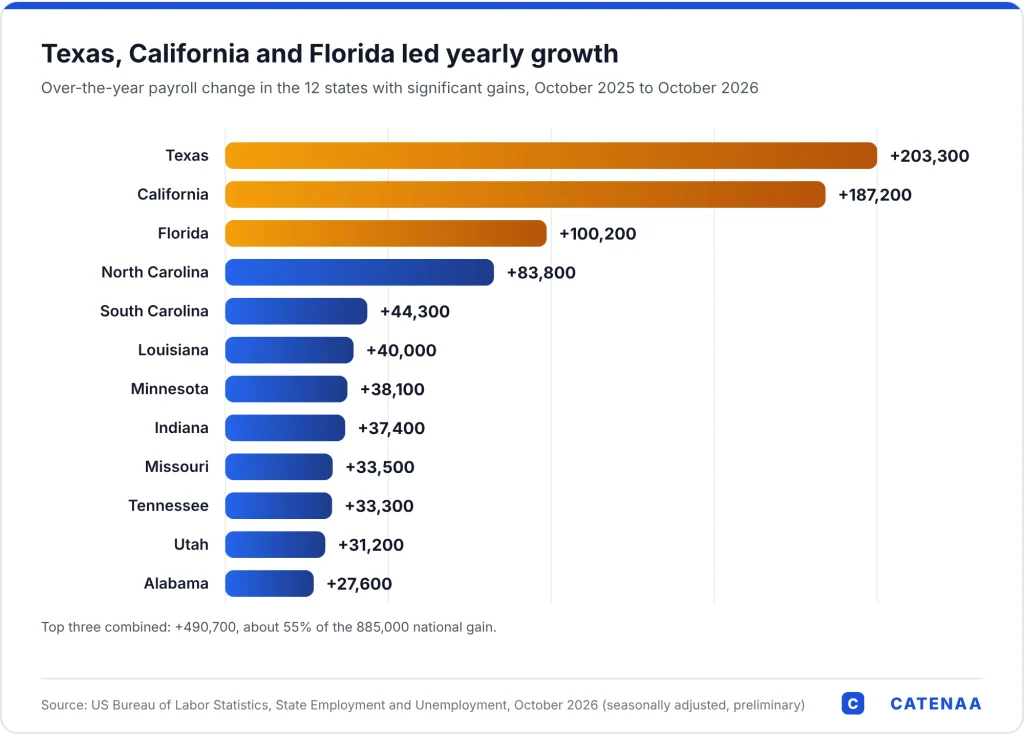
Over the year, Texas, California and Florida added 490,700 jobs, about 55% of the national gain.
October state payroll gains were narrow, according to the Bureau of Labor Statistics. Its November 20 report found significant job growth in only four states. Payrolls were essentially unchanged in the other 46 states and the District of Columbia. Meanwhile, the national unemployment rate stood at 4.1%, little changed from September.
Where the state payroll gains landed
California led with 47,100 new jobs, a 0.3% rise. Indiana followed with 15,900, or 0.5%. Kansas added 7,100 and Iowa 7,000, gains of 0.5% and 0.4%. Together, the four states added 77,100 jobs.
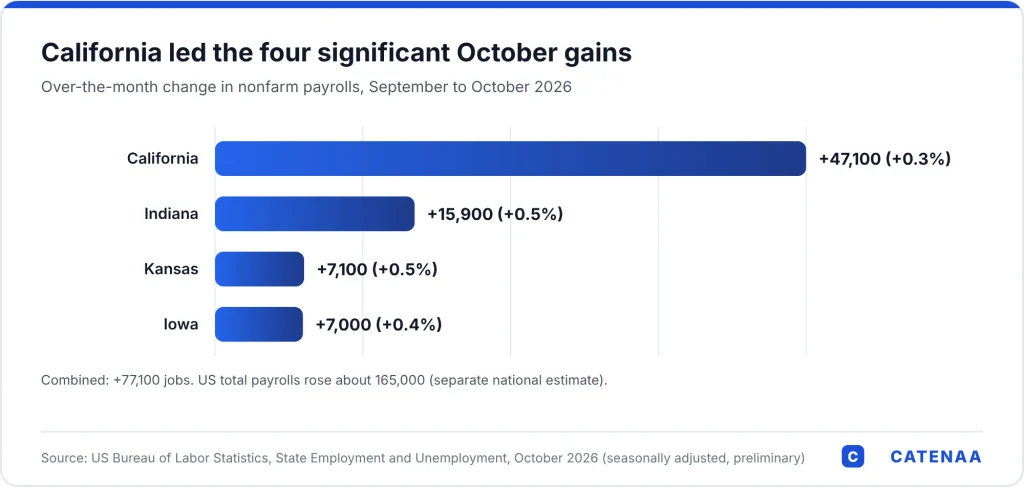
For context, total US payrolls rose by about 165,000 in October, per national BLS data. On that basis, the four states equal roughly 47% of the national gain. Still, the two figures come from separate estimates, so the share is a guide rather than an exact split. BLS will also revise these preliminary state figures next month.
Equally important, essentially unchanged does not mean no hiring. BLS only flags changes that pass a 90% confidence test. Some of those 46 states may have added jobs, while others may have lost them.
A puzzle in California
California’s numbers point in two directions. It led October hiring, yet its jobless rate stands at 5.0%, according to state labor force data. Along with Connecticut, Michigan and DC, it is one of four areas with rates significantly above the national level. By contrast, South Dakota posted the lowest rate at 2.0%.
Colorado showed the clearest weakening. Its rate rose 0.3 points to 4.4%, the only significant increase in October. Meanwhile, rates fell in DC, Florida, New Hampshire and Pennsylvania. Overall, 19 states had lower rates than the nation, while 28 showed no clear difference.
A Midwest bright spot
Three of the four growth states sit in the Midwest. Indiana, Kansas and Iowa each grew payrolls by 0.4% to 0.5% in a single month. For a one-month move, that pace stands out. Their jobless rates read 3.4%, 3.9% and 3.3%, against 4.1% nationally.
However, these are small labor markets. Combined, the three states added 30,000 jobs, fewer than California alone. So, the Midwest signal points to local strength rather than a national turn.
Why concentration matters for credit
Over the year, hiring looks broader but still uneven. Twelve states posted significant gains from October 2025, led by Texas with 203,300 jobs, per state payroll tables. California added 187,200 and Florida 100,200. Combined, those three account for about 55% of the 885,000 national increase. By growth rate, Louisiana led at 2.0%, ahead of South Carolina and Utah at 1.8%. Meanwhile, 38 states and DC showed no significant change over the year.
For lenders, this pattern deserves a close look. Regional banks earn their income where their borrowers work and spend. When job growth clusters in a few states, local consumer and property credit can drift apart. For example, a lender focused on Colorado now faces a rising jobless rate, while an Indiana lender sees steady hiring. As a result, national averages may hide stress in regions with flat payrolls.
One gap limits the analysis. The household survey skipped October 2025 because of a funding lapse, so BLS dropped its usual yearly jobless comparison. Metro area data follow on December 2, and the November state report arrives on December 18.