


August 15, 2026 – Bitcoin has gone quiet, but the buyer base underneath it is changing. Company treasuries now sell, fund flows have turned and dollar tokens keep growing.

In Summary
Bitcoin traded near $62,991 on 14 August, roughly 50 percent below its October 2025 record close.
Strategy sold 3,328 bitcoin across two weeks, raising about $213.3 million to fund dividends and buybacks.
US spot bitcoin ETFs took in $865.3 million from 3 to 7 August, then lost $329.0 million in four sessions.
Stablecoin supply reached a record $383.8 billion, up 22.7 percent over 12 months.
The Fed held rates at 3.50 to 3.75 percent, while the 30-year Treasury yield climbed to 5.21 percent.
The global crypto market has slipped into one of its quietest spells of 2026. Bitcoin traded near $62,991 on 14 August. Meanwhile, all digital assets together were worth close to $2.25 trillion. Daily turnover stayed thin at roughly $46.1 billion. Yet under that calm surface, the owner base is shifting fast. Big holders are selling. New money keeps arriving on chain. Those two forces now pull in opposite ways.
Crypto Market Swings Fade to Yearly Lows
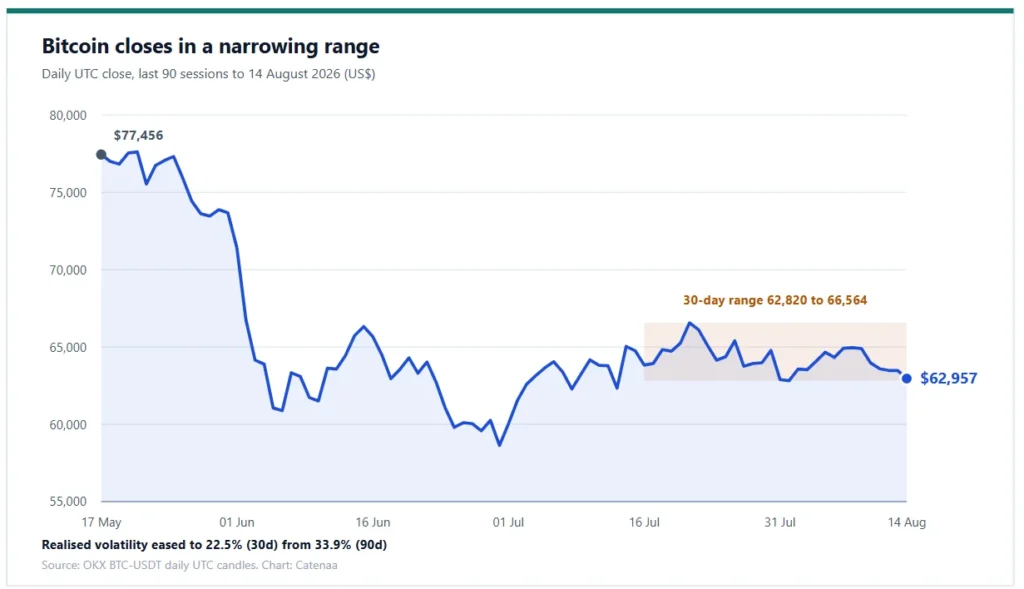
Bitcoin has traded inside a very tight band. Over the past 30 sessions, it moved between about $62,820 and $66,564. That whole span covers just 6.0 percent. Price swings tell the same story. Yearly volatility over 30 days eased to about 22.5 percent. Across 90 days, it ran near 33.9 percent.
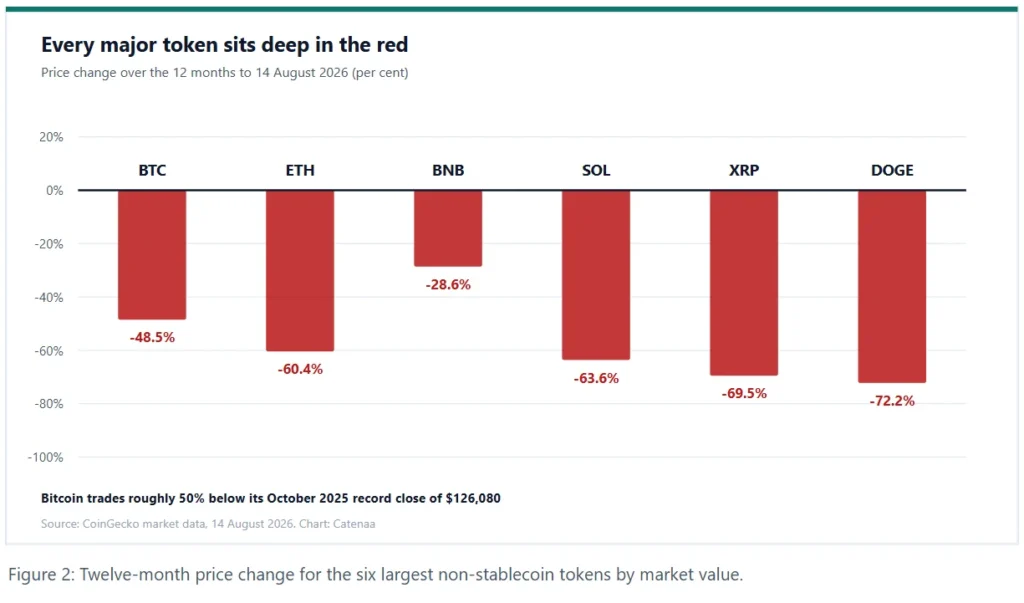
But calm does not mean strength. Bitcoin sits about 50 percent below its record close of $126,080. That peak came in October 2025. Ether looks weaker still. It trades near $1,872 after a 60 percent slide in a year. Solana, XRP and Dogecoin each lost more than 60 percent too. So this range looks like a pause inside a deep fall, not a new floor.
One name stands apart. Zcash has gained more than 1,100 percent in a year. Privacy coins have drawn fresh bids while the majors drift. Hyperliquid also holds a small yearly gain. Otherwise, the top of the board looks bruised.
Market share data adds another layer. Bitcoin holds 56.2 percent of total value. Ether accounts for a further 10.0 percent. Strikingly, the two largest dollar tokens now cover 11.3 percent between them. Cash-like assets therefore rival ether in scale. That mix shows a market still parked in safety.
Strategy Turns From Bitcoin Buyer to Seller
The biggest change came from the largest company holder. Strategy told the SEC that it sold 1,690 bitcoin from 3 to 9 August. It had already sold 1,638 coins the week before. Together those sales total 3,328 coins and raised about $213.3 million.
The reason matters as much as the size. Strategy used the cash to pay preferred dividends. It also bought back its own preferred shares. In short, the firm now turns bitcoin into balance sheet support.
Its treasury still holds 840,447 coins. The average buy price sits at $75,385. At today’s price, that stake is under water by roughly $10.4 billion. Its dollar reserve stood at $4.65 billion on 9 August.
So the market has lost a steady bid. Company treasuries soaked up heavy supply through 2024 and 2025. Now the largest of them adds coins to the float instead.
Spot ETF Flows Flipped Within Days
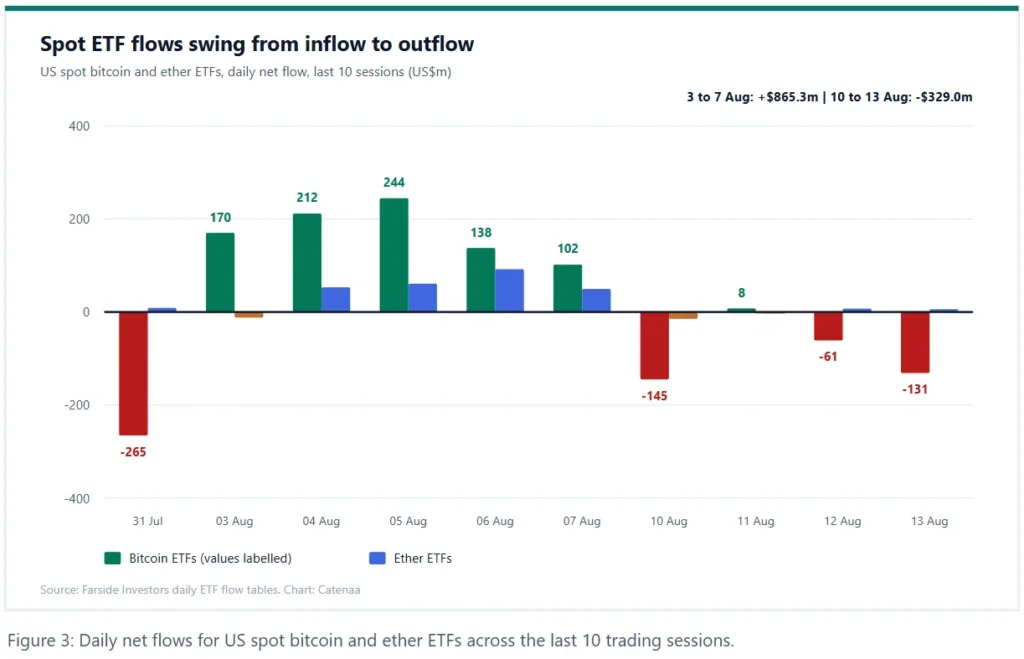
Funds delivered an equally sharp turn. US spot bitcoin ETFs pulled in $865.3 million from 3 to 7 August. Then the same products lost $329.0 million over the next four sessions. Total net inflows since launch still sit near $51.9 billion.
Ether funds acted quite differently. They gathered $243.7 million in the first August week. After that, they gave back only $3.0 million. Their total since launch now stands near $11.5 billion.
Volume trends deserve a mention as well. Turnover of about $46.1 billion across a day looks light by recent norms. Thin books cut both ways. Small orders can move price further than usual. As a result, any flow shift may land with extra force.
That split deserves attention. Buyers seem happy to hold ether while they trim bitcoin risk. In the past, such rotation often came before a change of leader among the majors. Watch this gap closely in the weeks ahead.
Stablecoins Grow While Token Prices Fall
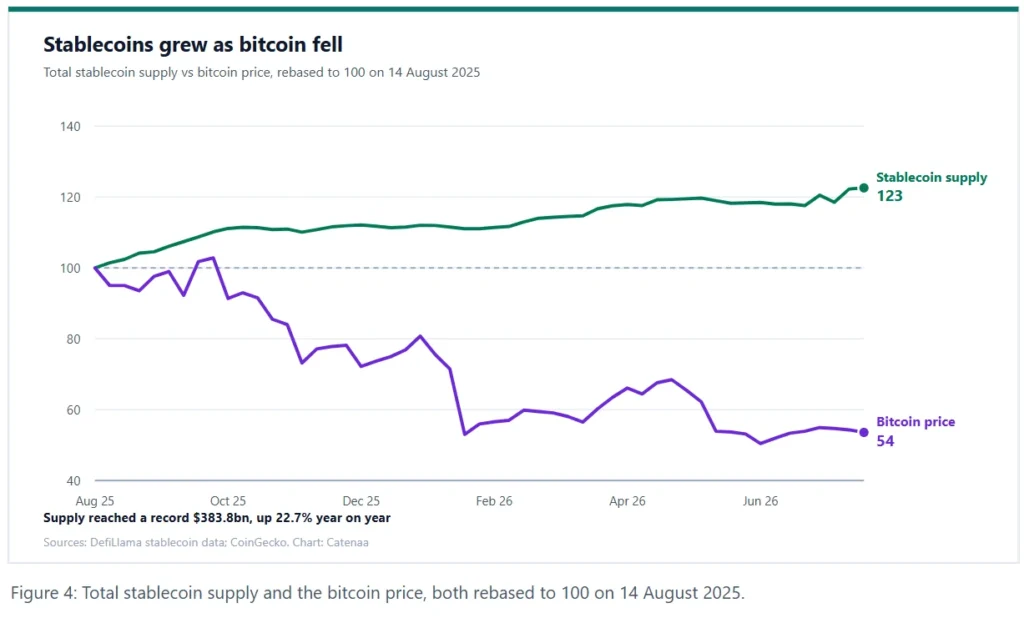
Meanwhile, the payment layer keeps growing. Total stablecoin supply hit about $383.8 billion, a fresh record. That figure rose 22.7 percent in a year. It also gained 4.1 percent in just 30 days.
The contrast is stark. Token prices fell close to 50 percent over the same year. Still, dollar balances on public chains grew by more than a fifth. Payment rails, treasury desks and lending pools all kept scaling through the slump.
DeFi shows early signs of a floor as well. Total value locked sits near $74.9 billion. That reading is 52.5 percent lower than a year ago. Even so, it has barely moved in the past month. In plain terms, the forced selling phase looks largely done.
High Rates Still Cap the Upside
Macro forces explain much of the drag. The Fed held its target range at 3.50 to 3.75 percent on 29 July. Members split nine to three. All three who dissented wanted a quarter point hike right away.
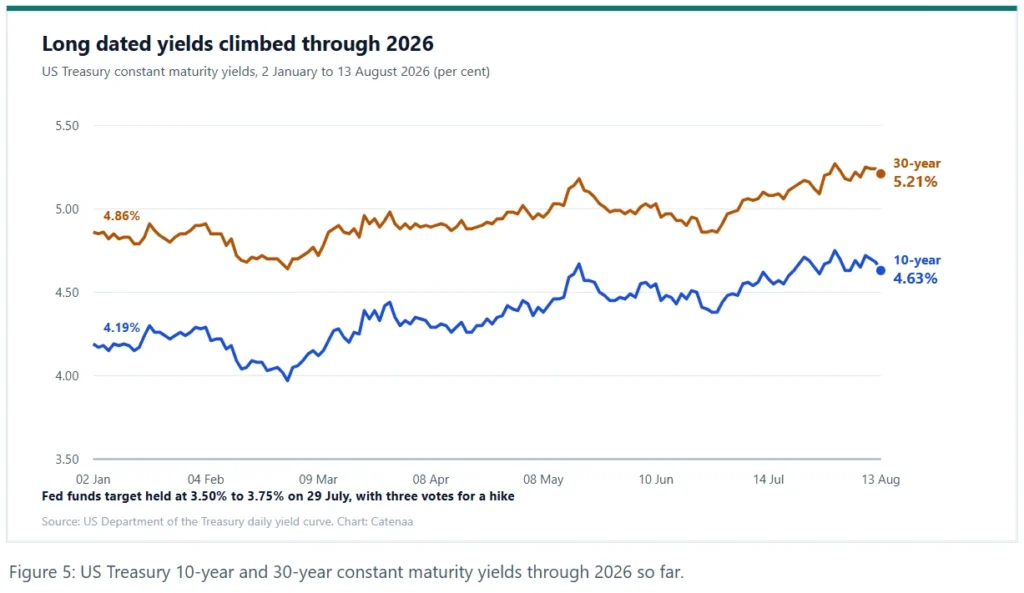
Bond markets echoed that hawkish tone. The 10-year Treasury yield closed at 4.63 percent on 13 August. It began the year at 4.19 percent. The 30-year yield rose to 5.21 percent from 4.86 percent. Higher long dated yields lift the bar for every asset that pays no income.
Policy makers also flagged energy shocks and Middle East risk. So easier money looks unlikely until inflation cools for real. Crypto prices lean heavily on that timeline.
What the Next Quarter Could Bring
Four things will shape the path from here. First, watch whether Strategy keeps selling each week. More sales would confirm a lasting shift in company treasury habits. A pause, by contrast, would clear an obvious weight.
Second, judge ETF flows over weeks, not days. Four weak sessions do not end a trend. But a second losing week in a row would point to real buyer fatigue.
Third, track the gap between stablecoin growth and token prices. Rising dollar balances act as buying power in waiting. Once faith returns, that cash can move very quickly.
Fourth, respect the macro calendar. Softer inflation prints would revive rate cut bets fast. Under that path, high beta assets tend to react first and hardest.
Quiet ranges rarely last forever. Tight bands usually break into wide moves, though the way out stays unclear. For now, patient sizing and firm risk limits look sensible. Traders should also drop any anchor on old cycle highs. The next move will likely start with a flow shift, not a headline.
Three markers would signal a genuine turn. Weekly ETF inflows would need to hold above $500 million. Corporate treasury sales would need to stop. Finally, the 30-year yield would need to slip back under 5 percent. Until those boxes tick, rallies will likely stay short and shallow.