


September 12, 2026 – Investors pulled $25.11bn from US long-term funds in a single week. Rising government bond yields now compete hard for the same money.
Mutual fund outflows reached $25.11bn in the week to 2 September, according to the Investment Company Institute. Equity funds took almost the entire hit. Furthermore, the exodus landed just as government bond yields surged.
One week rarely settles an argument. Still, the pattern fits a wider shift. Savers can now earn nearly 5% from a US Treasury note, so equity risk looks less attractive.

In Summary
US long-term funds lost $25.11bn in the week to 2 September, ICI estimates show.
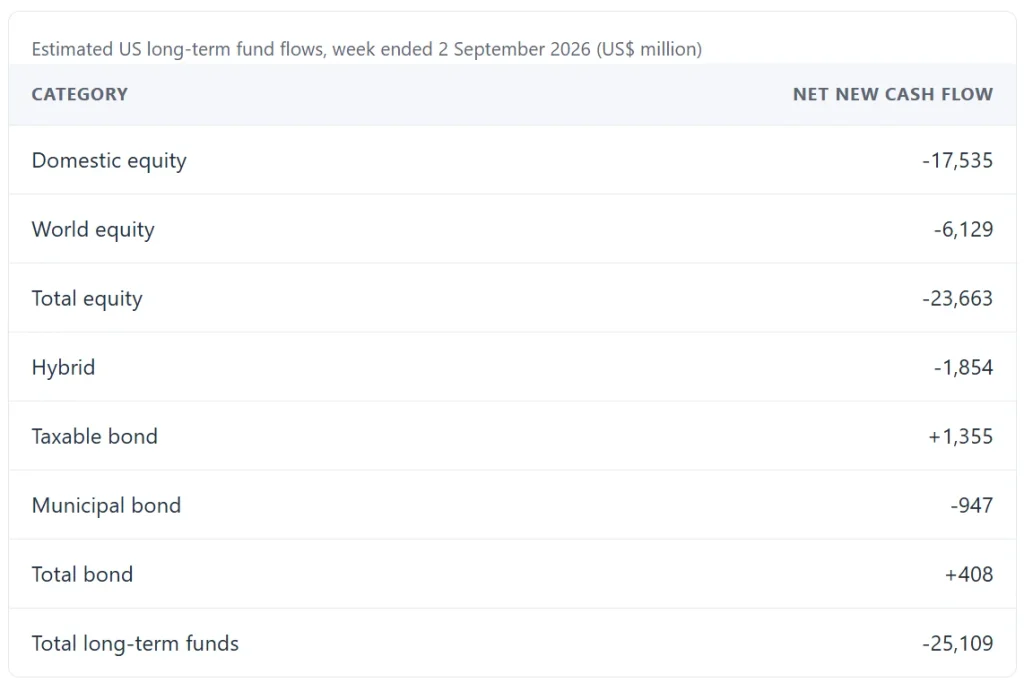
Equity funds gave up $23.66bn, and domestic equity alone shed $17.54bn.
Bond funds squeezed out a $408m inflow because taxable bond demand offset municipal selling.
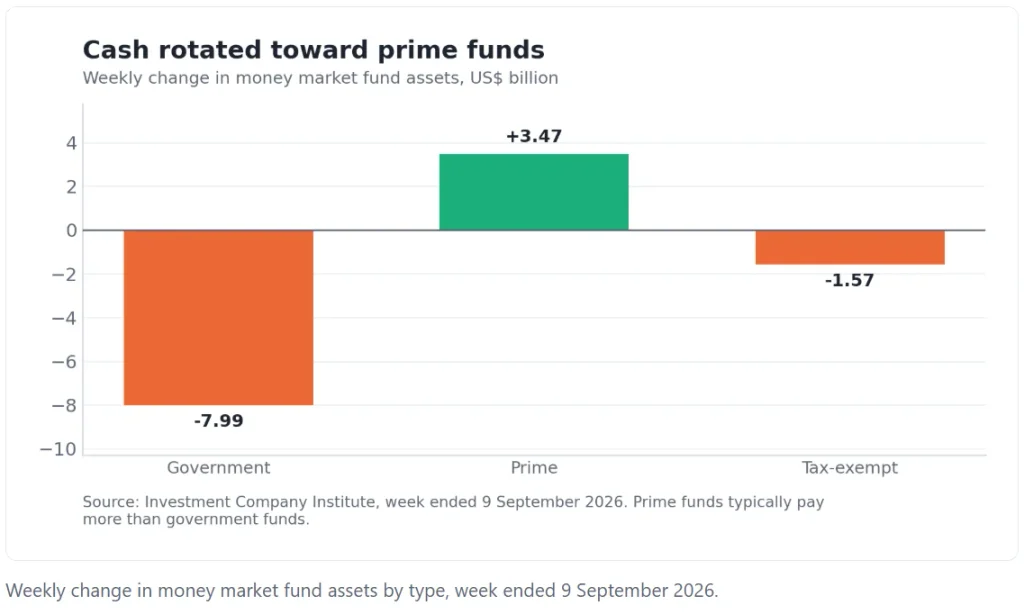
Money market assets slipped to $7.973trn, yet prime funds still gained $3.47bn.
Three-month bills yielded 4.07% on 11 September, so cash keeps competing with shares.
Where the mutual fund outflows landed
Domestic equity funds lost $17.54bn over the week. World equity funds shed a further $6.13bn. Hybrid funds, which blend shares and bonds, gave up $1.85bn.
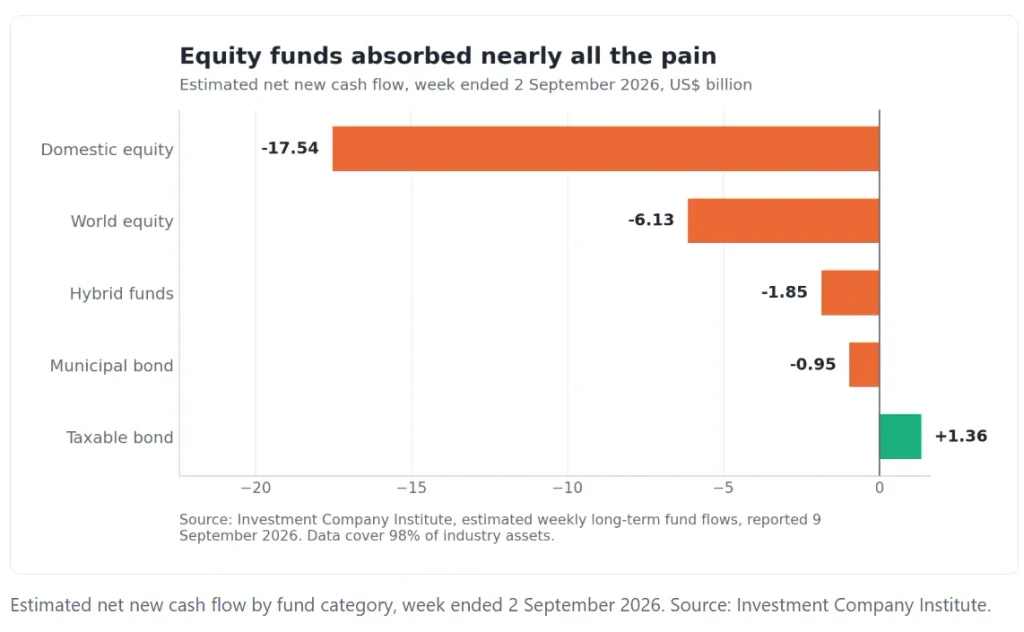
Bond funds fared better, though barely. Taxable bond products attracted $1.36bn. Municipal bond funds lost $947m, and the two lines netted out at a $408m inflow.
Scale matters here. ICI puts the total outflow at roughly 0.1% of long-term fund assets as of 31 July. Therefore, this was a rotation rather than a stampede.
Coverage also deserves a note. The estimates capture about 98% of industry assets, so small gaps remain. Weekly figures get revised too, and revisions can move the headline.
The split between domestic and world equity looks telling. American funds lost almost three times as much as international ones. Investors trimmed their largest holdings first, which is the usual pattern.
Why bond yields changed the maths
Cash and government debt now pay real money. Three-month Treasury bills yielded 4.07% on 11 September, up from 3.89% eight days earlier. Ten-year notes closed at 4.96%.
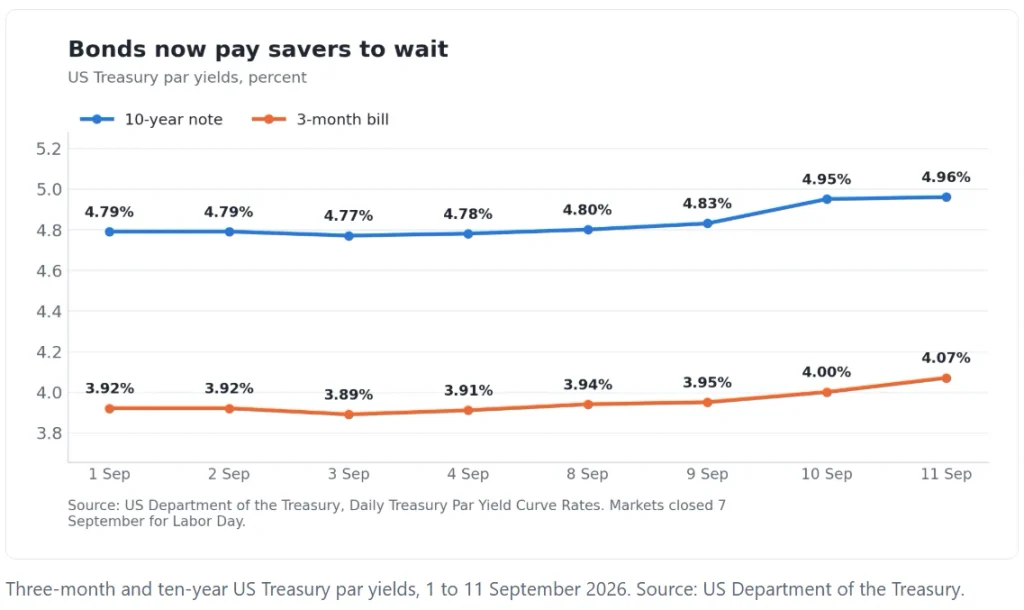
Compare that with inflation. The Bureau of Labor Statistics put annual price growth at 3.4% in August. A 4.96% coupon therefore still beats inflation by about 1.5 percentage points.
Positive real yields change behaviour. For most of the past decade, savers earned nothing after inflation. Now, a government note preserves purchasing power and pays a margin on top.
Rising yields cut both ways for bond funds
New buyers welcome higher yields. Existing bondholders do not, because prices fall as yields climb. Bond funds therefore report losses even while their income improves.
Duration explains the difference. Longer maturities swing hardest for any given yield move. Municipal funds hold plenty of long-term paper, which helps explain their $947m outflow.

Money funds hold the line
Cash vehicles look remarkably stable through the turbulence. Money market fund assets stood at $7.973trn in the week to 9 September. That total slipped by only $6.10bn.
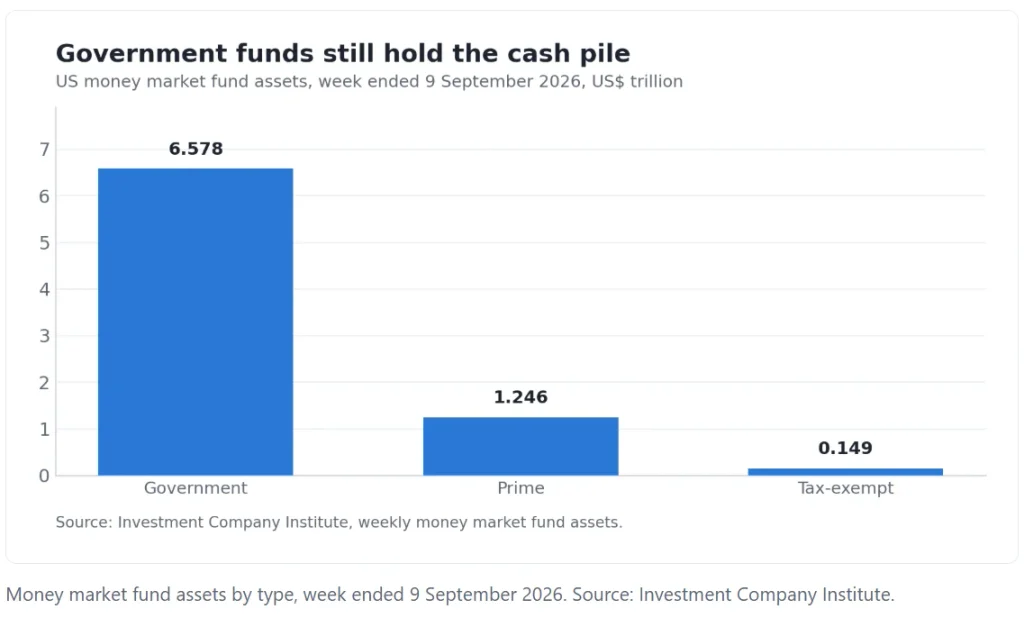
Beneath the surface, savers shuffled. Government funds lost $7.99bn, while prime funds gained $3.47bn. Prime portfolios buy commercial paper, so they usually yield a little more.
Tax-exempt funds shrank by $1.57bn to $149.35bn. That corner of the market stays tiny next to the government pool. Nevertheless, its steady decline mirrors the municipal bond outflows above.
Government funds still dominate by a wide margin. At $6.578trn, they hold more than four-fifths of all money fund assets. Safety clearly outranks yield for most large cash managers.
Retail and institutional holders also parted ways. Households added $891m, so their total reached $3.115trn. Institutional money fell from $6.99bn to $4.858trn.
That divergence carries a message. Corporate treasurers move quickly when rates shift because they manage cash actively. Individual savers tend to stay put, so their balances drift upward.
What this means for allocation
A single weekly print never proves a trend. Nevertheless, the direction of travel now looks consistent. Higher policy rates pull savings toward short duration and away from equity risk.
Pension funds and insurers face the same calculation. Many can now meet their long-term promises with government bonds alone. Such buyers may therefore trim equity allocations over the coming quarters.
Consider the arithmetic facing a saver today. A three-month bill locks in 4.07% with almost no risk. An equity index must therefore beat that hurdle before the extra volatility looks worthwhile.
Effective fed funds sat at 3.63% in the latest H.15 release. Should the Federal Reserve tighten again, deposit and fund yields would follow. Cash would then compete even harder.
What to watch next
Watch the next ICI weekly estimate closely, since it will cover the bond route itself. A second heavy equity outflow would confirm the rotation. Meanwhile, a bond fund inflow would show buyers chasing the new yields.
Municipal funds deserve attention as well. They have leaked cash while Treasury yields climbed. Any stabilisation there would hint that long-duration appetite is returning.
The Federal Reserve’s decision on 16 September sets the backdrop. Another increase would push short rates higher again. Cash would then look even more attractive against shares.
What this means for savers
Nobody should read one week as a signal to sell. Timing markets rarely works, and equity returns still compound over decades. Yet the relative maths has clearly shifted.
Ask two practical questions instead. Does your cash earn a competitive rate today? And does your bond exposure match the duration risk you actually want to hold?