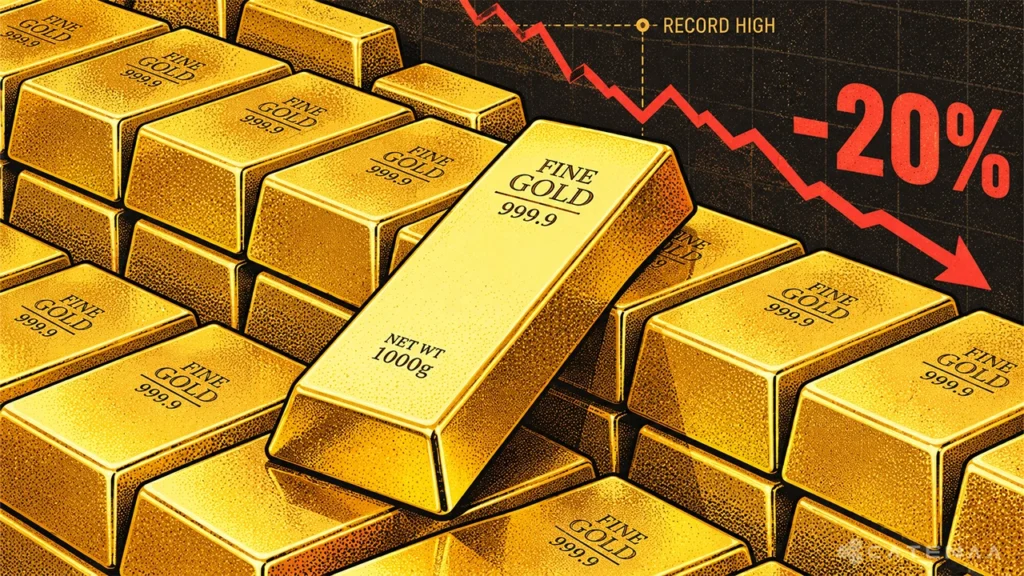


September 17, 2026 – Bullion has given back a fifth of its value since January. Reserve managers bought all the way down, and rates explain the gap.

In Summary
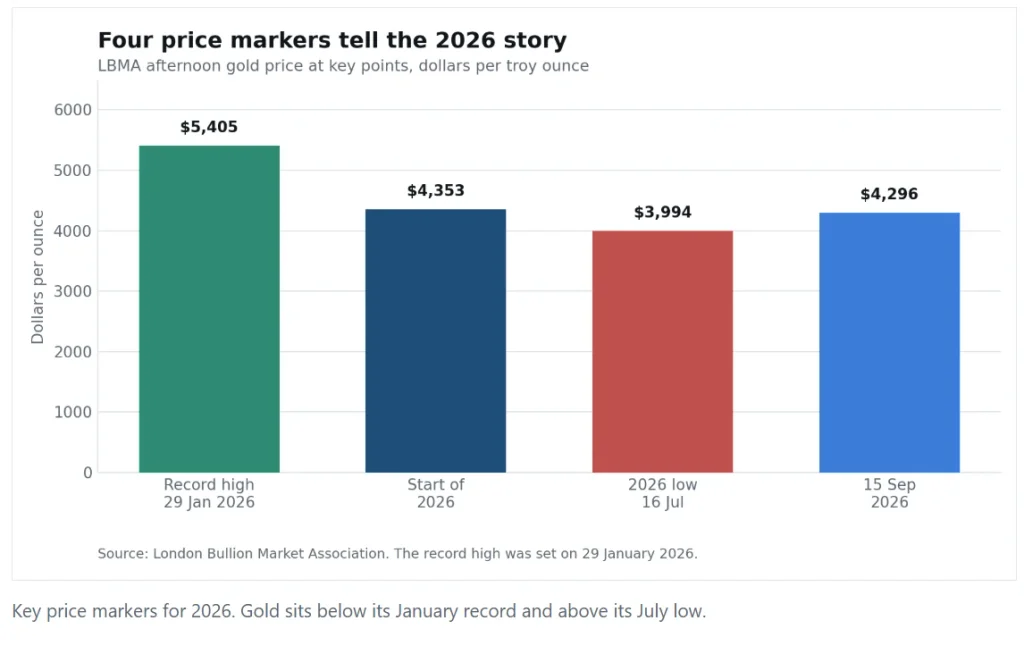
Gold settled at 4,296.15 dollars an ounce on 15 September 2026.
That is 20.5 percent below the record of 5,405.00 dollars set on 29 January.
The 2026 low of 3,993.55 dollars came on 16 July.
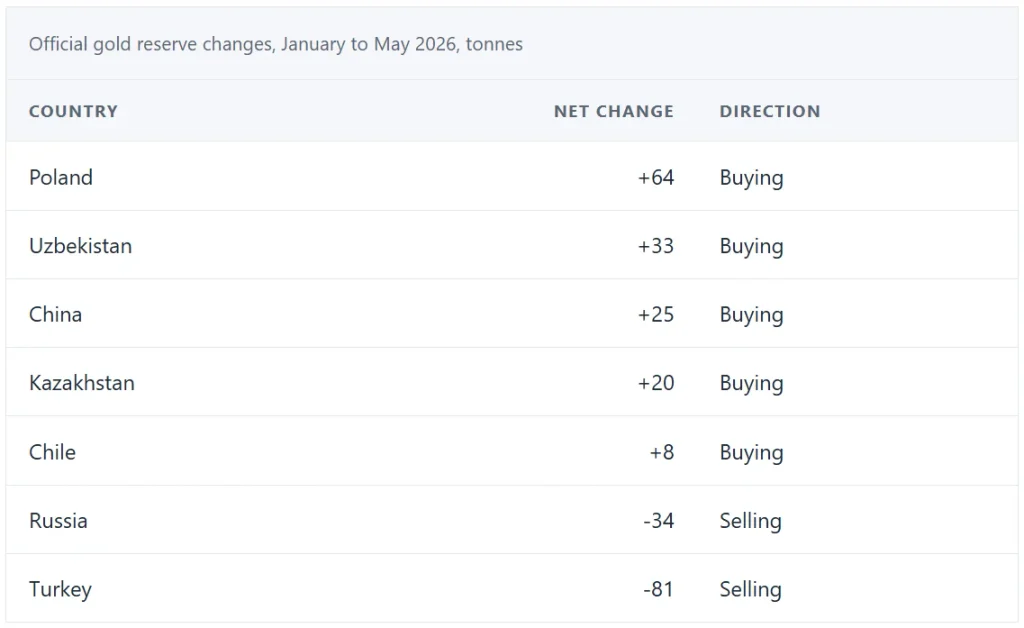
Central banks added a net 41 tonnes in May, led by Poland, Uzbekistan and China.
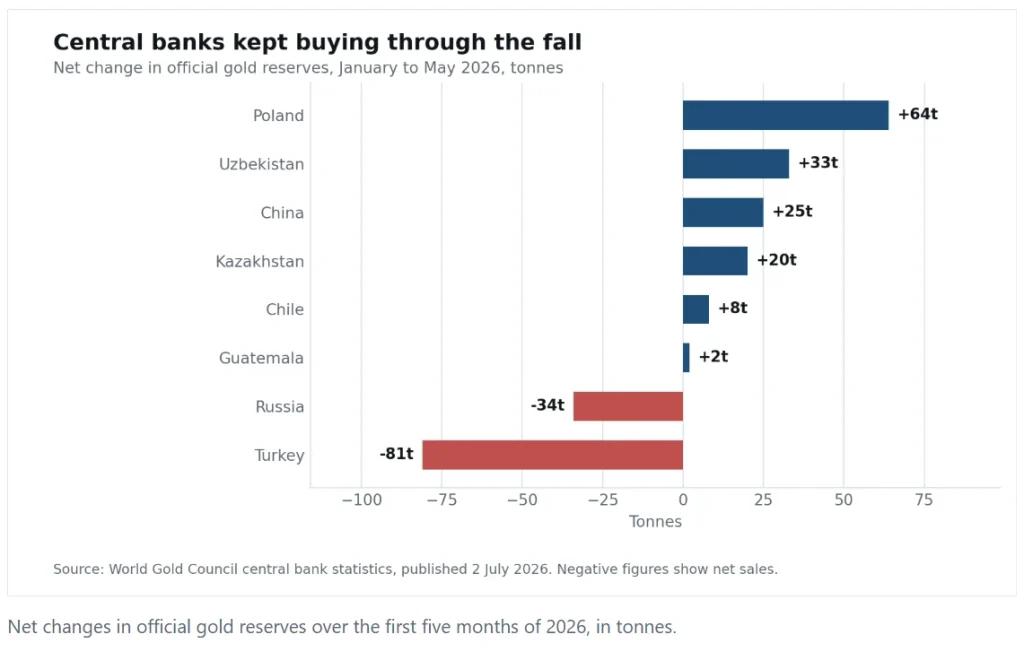
Turkey sold 81 tonnes and Russia 34 tonnes over the first five months.
Gold has quietly given back a fifth of its value. The gold price settled at 4,296.15 dollars an ounce on 15 September. That sits 20.5 percent below the record set in January.
Central banks did not cause the drop. They kept buying through the whole decline. Interest rates explain far more.
Wednesday made that link plain. The Federal Reserve raised rates for the first time since 2023.
How far the gold price has fallen
The peak came early. Gold reached 5,405.00 dollars an ounce on 29 January 2026. No session has come close since.
Selling then ran for six months. July brought the low of 3,993.55 dollars on the 16th. That marked a fall of 26.1 percent from the high.
A partial recovery followed. Prices have since regained about 7.6 percent from that trough. Even so, gold trades roughly where it started the year.
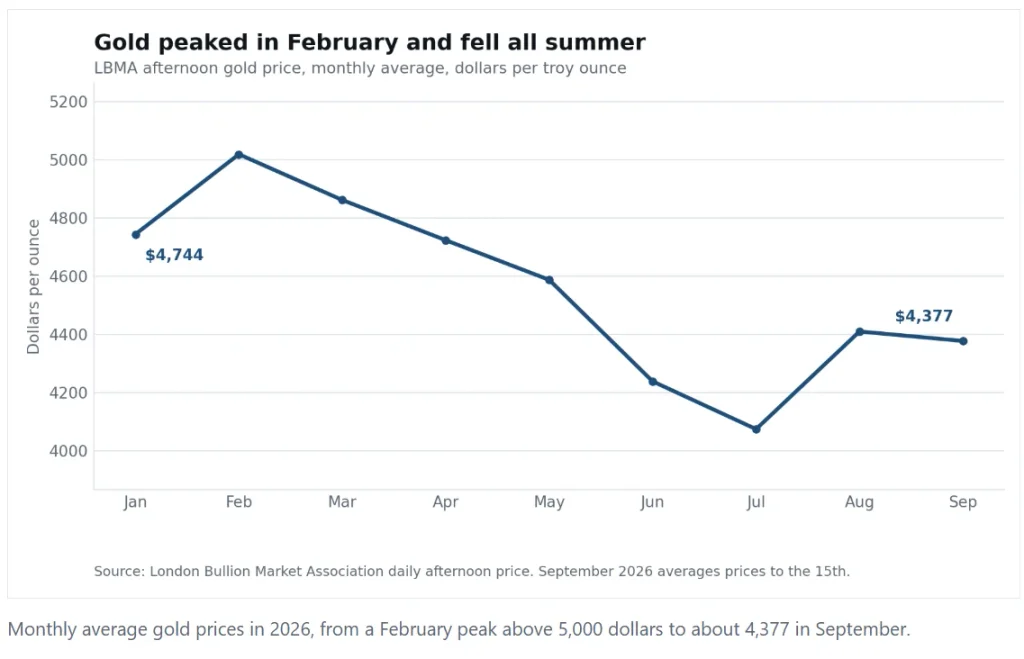
Monthly averages show the shape clearly. February averaged 5,019 dollars, the strongest month on record. July then averaged 4,074 dollars, nearly a thousand dollars lower.
September has stayed choppy. Prices touched 4,467 dollars on the 3rd before easing to 4,267 on the 14th. Traders kept adjusting ahead of the Fed meeting.
Rates are doing the damage
Gold pays no income. Higher yields therefore raise the cost of holding it. That relationship drives most short-term moves.
American yields climbed hard this year. The two-year note reached 4.67 percent on 15 September. It opened January at 3.47 percent.
Policy followed the market. The Federal Open Market Committee lifted its range to 3.75 to 4.00 percent on 16 September. All twelve members backed the move.
Short Treasury bills now yield 4.11 percent. Cash has become a genuine competitor to bullion for the first time in years.
Storage and insurance add to the gap. Physical holdings cost money to keep safe. Those costs used to look trivial against zero yields, and no longer do.
Official buyers ignored the slide
Reserve managers think in decades. They added a net 41 tonnes in May alone, according to the World Gold Council.
Poland led every buyer. It took 64 tonnes over the first five months. Uzbekistan added 33 tonnes and China 25 tonnes.
Two large sellers ran the other way. Turkey cut reserves by 81 tonnes and Russia by 34 tonnes. Both faced domestic funding pressures.
Smaller buyers filled the gap quietly. Kazakhstan added 20 tonnes and Chile about 8 tonnes. Guatemala, Bolivia and Uruguay each took smaller amounts.
Intentions point the same way. A record 45 percent of surveyed central bankers expect their own gold holdings to rise over the coming year.
Why the two signals disagree
Different buyers answer different questions. Traders price the next six months, so rates dominate their thinking.
Reserve managers price the next twenty years. They worry about sanctions risk, currency concentration and geopolitical shocks. Those concerns have not eased.
Both views can hold at once. Gold can look expensive against 4 percent cash and still look cheap as insurance.
Price sensitivity also differs sharply. Reserve managers buy on a schedule rather than a chart. Their demand therefore steadies the market without setting the price.
The longer view still favours holders
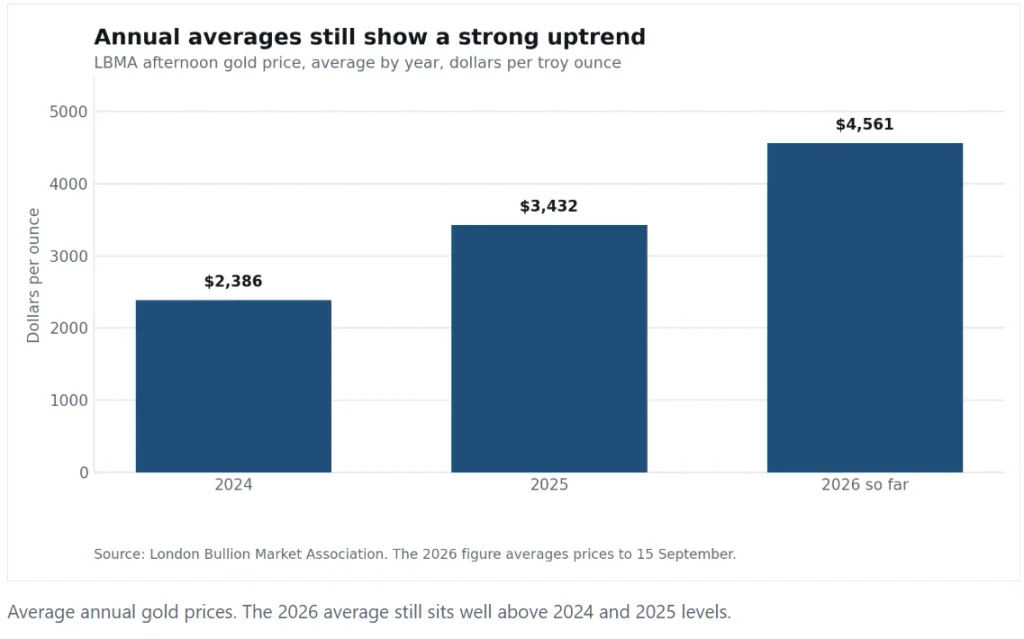
Step back and the picture changes. Gold averaged 2,386 dollars in 2024 and 3,432 dollars in 2025. This year it has averaged 4,561 dollars.
That is a rise of 91 percent across three years. A 20 percent drawdown inside such a run looks ordinary rather than alarming.
Volatility has risen alongside the price though. The 2026 range runs from 3,993 to 5,405 dollars. That spread equals a third of the low.
Anyone who bought at the January peak feels differently, of course. Entry point shapes the experience far more than the three year average does.
Miners and jewellers face their own version of this. Producers budgeted at much lower prices, so margins remain wide. Retail demand, however, weakens whenever prices swing hard.
What to watch from here
Rate expectations matter most. Fed projections now point to 4.1 percent by the end of 2026. Another increase would keep pressure on the metal.
Watch the monthly reserve data next. Any sign that Poland or China has paused would remove a steady source of demand. The World Gold Council publishes those figures each month.
Finally, follow the dollar. A weaker dollar usually lifts gold in dollar terms. That channel could offset some of the rate drag if American growth slows.
For allocators, the practical question is simple. Gold has done its job over three years and failed over eight months. Position sizing matters more than the direction call.