

September 12, 2026 – A synchronised selloff in government debt lifted US borrowing costs to a 52-week high. Hot inflation figures then sealed the move.
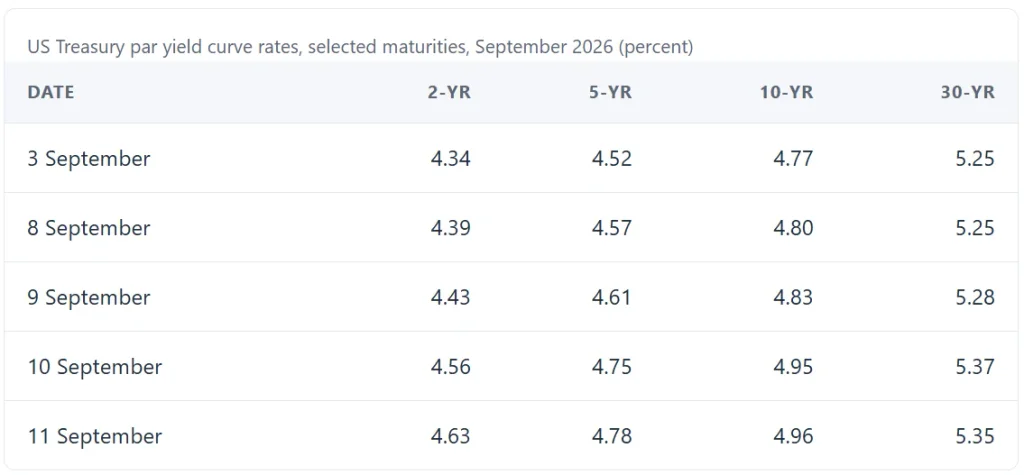
The 10-year Treasury yield closed at 4.96% on 11 September, a 52-week high, according to the US Treasury. Furthermore, the benchmark rate has gained 19 basis points in six trading sessions. Markets have not tested the 5% mark since 2023.
This selloff did not begin in Washington. Instead, it started in Tokyo and London. Long-dated bonds slid across three continents this week. Then US inflation data finished the job.

In Summary
The 10-year Treasury yield closed at 4.96% on 11 September, a 52-week high.
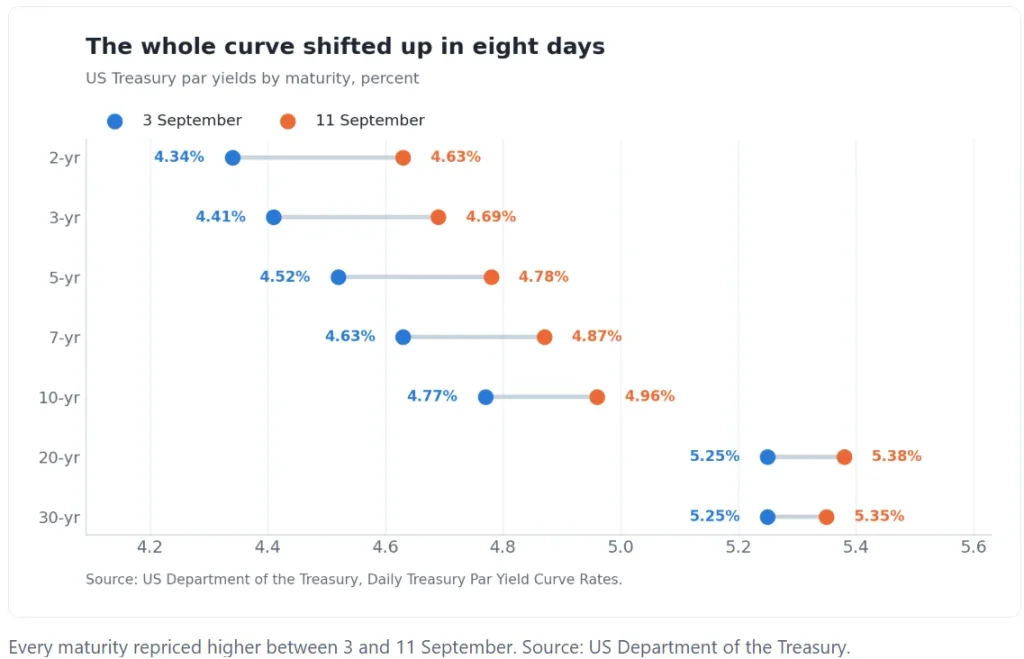
Yields rose across every maturity, and the two-year rate jumped 29 basis points in six sessions.
August consumer prices rose 0.4% on the month, so the annual rate held at 3.4%.
Gilt and JGB markets sold off first, which shows the pressure is global rather than local.
The Federal Open Market Committee meets on 15 and 16 September, with fresh projections due.
Why the 10-year Treasury yield jumped
Two forces pushed the 10-year Treasury yield higher. First, energy costs surged again. Second, traders abandoned hope of a rate cut this year. Both forces feed the same calculation because bond buyers price expected inflation into every long maturity.
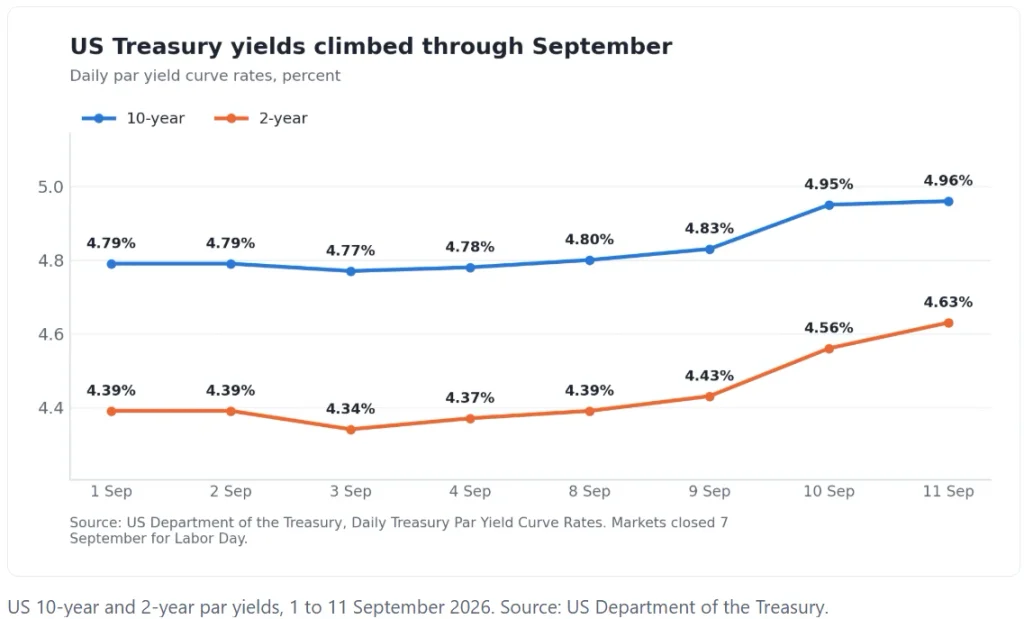
Look at the pace rather than the level. On 3 September, the 10-year rate sat at 4.77%. By 10 September, it reached 4.95%. Another basis point followed on Friday. Therefore, the market repriced roughly a fifth of a percentage point within two weeks.
Speed matters more than direction here. Gradual moves let banks and funds hedge calmly. Sharp moves force them to sell, so selling begets more selling. This week showed that mechanism at work.
Oil sits behind the inflation maths
Crude prices frame every rate forecast right now. Brent settled at $104.61 a barrel on Friday, having traded just under $106 during the session. West Texas Intermediate finished at $100.05.
Those levels feed straight into headline inflation. Fuel costs also lift transport, food, and manufacturing bills within months. Bond investors therefore demand extra compensation before they lend for a decade.
Inflation data reset the Fed trade
The Bureau of Labor Statistics reported a 0.4% monthly rise in consumer prices for August. Annual inflation held at 3.4%. Core prices rose 0.3% on the month and 2.4% over the year.
Energy did most of the damage. Gasoline jumped 3.9% in August alone, and it accounted for over a third of the headline increase. Over twelve months, gasoline costs rose 27.4%. Meanwhile, the energy index gained 16.3%.
Rate futures reacted within minutes. Before the release, traders assigned roughly 70% odds to a September hike. Afterwards, that figure climbed toward 90%. These numbers reflect market pricing rather than any Federal Reserve guidance.

A synchronised global bond selloff
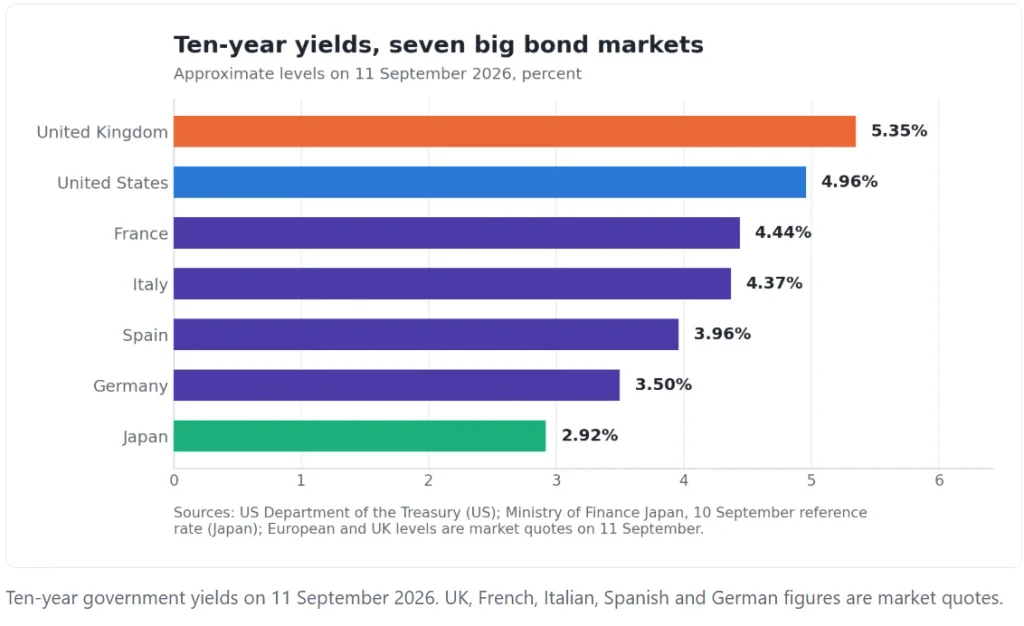
Japan supplied the first tremor. Ten-year government bonds there yielded 2.92% on 10 September, according to the Ministry of Finance. That rate touched 3.01% earlier in the month, a level unthinkable a few years ago.
Japanese yields matter far beyond Tokyo. Domestic institutions there hold vast pools of foreign bonds. Higher home yields tempt that money back, so overseas markets lose a steady buyer.
British debt then took the strain. Ten-year gilts traded near 5.35% on Friday, while 30-year gilts hovered close to 5.95%. Continental markets followed at a distance, with French and Italian 10-year paper around 4.4%.
Germany remains the anchor of the euro bloc. Bunds yielded roughly 3.5%, well below every other market in the group. Such a widespread shows investors still treat German paper as the regional safe asset.
The long end tells a different story
Short maturities moved fastest, which matters for policy watchers. Two-year yields rose 29 basis points between 3 and 11 September. Thirty-year yields added only 10 basis points over the same stretch.
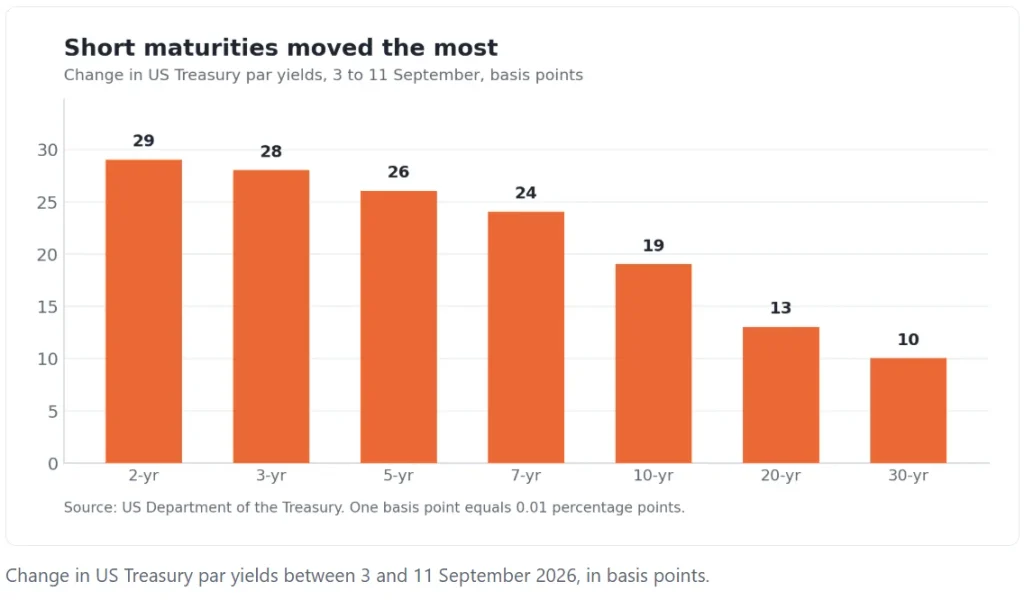
Such a pattern signals a policy story rather than a fiscal panic. Investors expect tighter money soon, so front-end rates climb hardest. Yet the curve still slopes upward because the 20-year rate finished at 5.38%.
What the move costs borrowers
Mortgage rates track the 10-year yield closely. Corporate treasurers also watch it before they price new debt. Every 20 basis point move therefore adds real cost across the economy.
Cash savers gain, at least for now. Three-month bills yielded 4.07% on Friday, up from 3.89% eight days earlier. Consequently, money funds keep competing hard with equities and credit.
Existing bondholders pay the bill instead. Prices fall when yields rise, so long-dated portfolios carry paper losses. A 30-year bond loses far more value than a two-year note for the same yield move.
Governments feel the squeeze as well. Washington refinances trillions of dollars each year at prevailing rates. Every additional basis point therefore, compounds across the debt stock over time.
What to watch next
The Federal Open Market Committee meets on 15 and 16 September, and it publishes fresh projections. Officials held the target range at 3.50% to 3.75% in July, on a nine-to-three vote. Three voters preferred an increase even then.
Effective fed funds sat at 3.63% in the latest H.15 release. A hike would lift that anchor toward 3.88%. Watch the dot plot as well, since the FOMC calendar confirms projections accompany this meeting.
Two questions now dominate the week. Will the 10-year yield break 5% and hold there? Do officials plan more tightening beyond September? Answers to both will set the tone for global bonds into the fourth quarter.
One caution belongs here. Markets often overshoot around round numbers, and 5% carries heavy symbolic weight. A sharp reversal would surprise nobody, though the inflation backdrop still argues for caution.