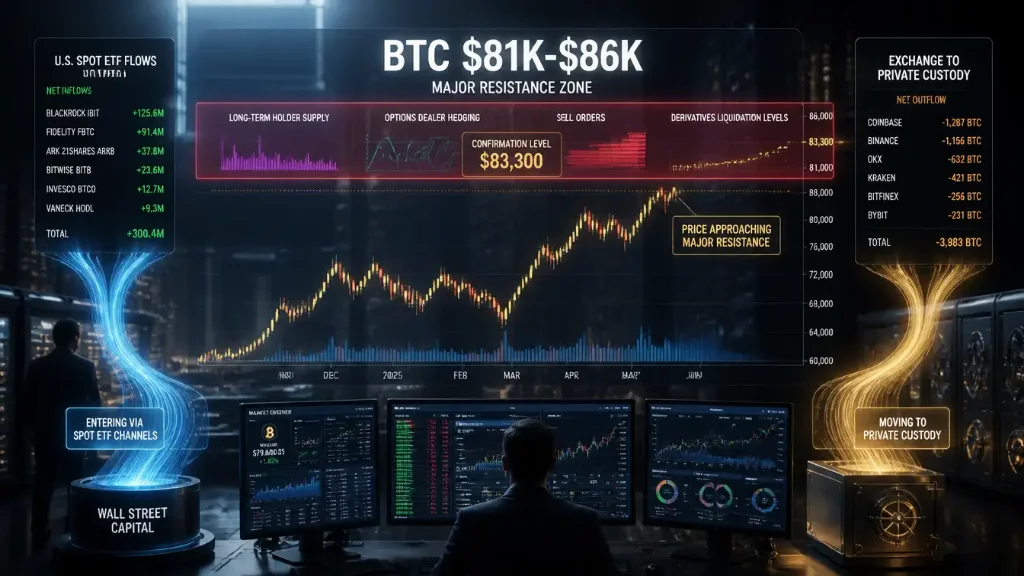


Wednesday, September 02, 2026- Bitcoin’s recovery toward its early-2026 highs faces a major test between $81,000 and $86,000, where several sources of potential selling pressure are converging, according to blockchain analytics firm Glassnode.
The range contains long-term holders near their breakeven prices, large self-custodied coin positions, options-related hedging levels and remaining short-liquidation clusters.
Glassnode said those factors make the area the most important resistance zone for bitcoin’s current recovery.
A sustained move through the range could reopen the path toward bitcoin’s January high. Failure to absorb selling pressure there could leave the latest rally vulnerable to reversal.
Bitcoin’s recent advance accelerated following the U.S. Treasury’s expansion of its existing securities buyback program and a large cryptocurrency short squeeze.
Treasury buybacks are liquidity-management operations involving government debt and should not be treated as quantitative easing or direct money creation.
The derivatives market provided a more immediate catalyst.
Glassnode said an Aug. 19 short-liquidation event was the largest since 2019.
As bitcoin climbed, traders holding leveraged positions betting on lower prices were forced to close those trades.
That created additional buying pressure and helped push the market higher.
Glassnode estimated that the rally consumed about 86% of the modeled liquidation clusters along its path.
Futures open interest subsequently fell about 11% when measured in bitcoin terms, indicating that substantial leverage had been removed from the market.
The behavior of perpetual futures funding rates also drew attention.
Funding remained broadly neutral through much of the short squeeze, Glassnode said.
That suggests bullish traders did not immediately replace the liquidated short positions with a large wave of leveraged long exposure.
The distinction matters because rallies driven heavily by leverage can become unstable when traders crowd into the same position.
A market advancing while leverage falls can indicate that spot demand is playing a larger role.
That does not eliminate downside risk, but it changes the structure of the rally.
U.S. spot bitcoin exchange-traded funds also returned to sustained net buying.
The funds recorded more than $2.8 billion in net inflows across eight consecutive trading days, according to Glassnode.
At the same time, bitcoin was moving away from centralized exchanges while wallets across several balance sizes accumulated coins.
Exchange withdrawals can reduce the amount of bitcoin immediately available for sale.
They do not guarantee that holders intend to keep the assets permanently, but sustained withdrawals are often watched as an indication of changing investor behavior.
The combination of ETF inflows and onchain accumulation has supported bitcoin’s recovery from earlier weakness.
The next challenge begins near $81,000.
Glassnode identified the $81,000 to $86,000 region as a dense supply zone where several independent market signals overlap.
A large group of long-term holders acquired bitcoin near those prices and is now approaching breakeven.
Some investors who endured months of losses may choose to sell once their positions return close to their original cost.
That creates potential supply as bitcoin approaches the range.
A heavy concentration of bitcoin that has remained in self-custody also begins near approximately $80,800, according to Glassnode.
Those holdings represent another group of coins entering profitable or near-breakeven territory.
Derivatives positioning adds another obstacle.
Glassnode said options dealers begin changing their hedging behavior around $82,300.
Dealer hedging can influence spot and futures markets because firms managing options exposure frequently buy or sell the underlying asset to keep their books balanced.
Above certain price levels, that activity can create additional resistance rather than reinforce the rally.
The effect depends on the structure of outstanding options positions and can change quickly as contracts expire or traders reposition.
Still, Glassnode sees the current positioning as another reason the low-$80,000 range matters.
The Aug. 19 short squeeze also left another concentration of potential liquidation activity between roughly $82,000 and $86,000.
That creates a complicated market structure.
Some traders may see higher prices as an opportunity to exit losing or breakeven holdings.
Others may be positioned for another squeeze if bitcoin continues advancing.
Visible sell orders and derivatives exposure add further resistance.
Glassnode’s argument is that these are not isolated technical signals.
They all cluster within approximately the same $5,000 price band.
That makes the zone a test of whether new demand is strong enough to absorb existing supply.
Glassnode highlighted approximately $83,300 as an important level within the resistance region.
A sustained move above that price, combined with continued spot ETF inflows, would suggest buyers are successfully absorbing supply.
The firm said such a development could strengthen the case for a continuation toward bitcoin’s earlier 2026 highs.
Simply trading above the level temporarily would be less convincing.
Sustained demand would need to continue while long-term holders, options dealers and other sellers respond to higher prices.
That makes ETF flows one of the indicators traders are likely to watch closely.
Glassnode also identified a much lower level that would invalidate much of the recovery.
A fall back toward approximately $62,900 would effectively unwind the recent rally, according to the firm.
That would represent a major reversal from the current recovery structure.
The wide distance between the resistance zone and that downside level illustrates how volatile bitcoin remains despite growing institutional participation.
ETF demand can strengthen the market, but it does not remove the influence of leverage, derivatives positioning and investor profit-taking.
Bitcoin’s next move may therefore depend less on whether buyers can push briefly above $81,000 and more on whether they can remain active throughout the $81,000 to $86,000 zone.
The market has already removed a large amount of short-side leverage.
ETF investors have returned with billions of dollars in net purchases.
Onchain data also points to accumulation across several wallet groups.
But higher prices are now bringing older holders closer to levels where they can exit without losses.
At the same time, options positioning and remaining liquidation levels create additional friction.
The result is a narrow price region where several parts of the bitcoin market are being tested simultaneously.
If demand absorbs that supply, the January high could come back into view.
If it does not, the $81,000 to $86,000 region may become the ceiling for the latest stage of bitcoin’s recovery.