

September 09, 2026 – Three of the best inflow weeks of the year almost erased a brutal first half. The 2026 ledger is still red.
In Summary
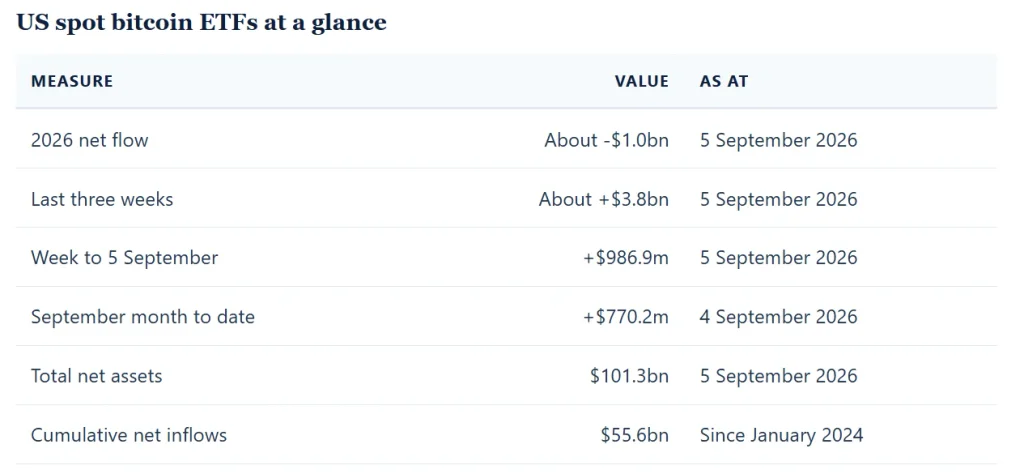
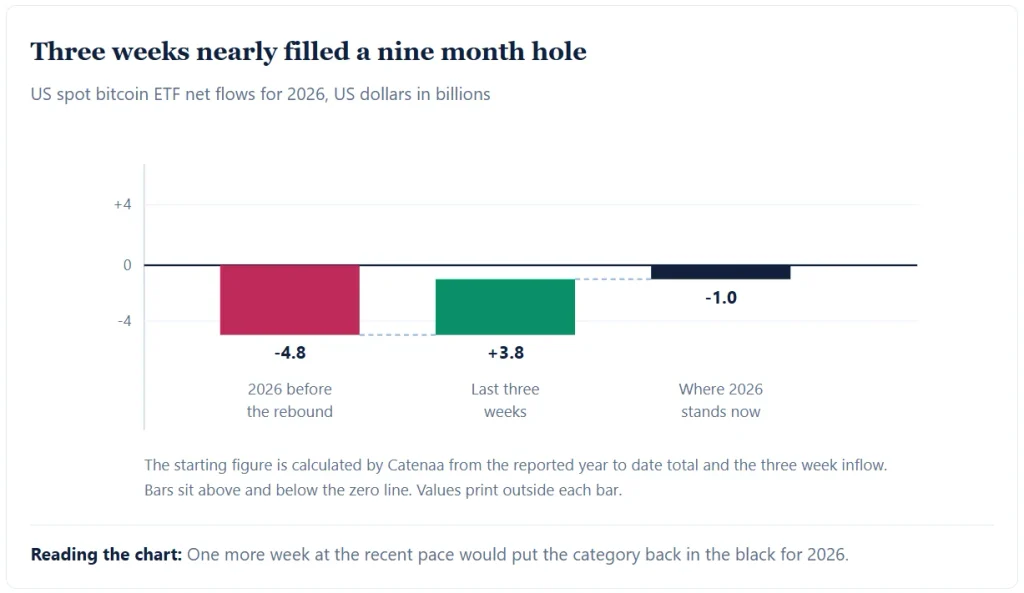
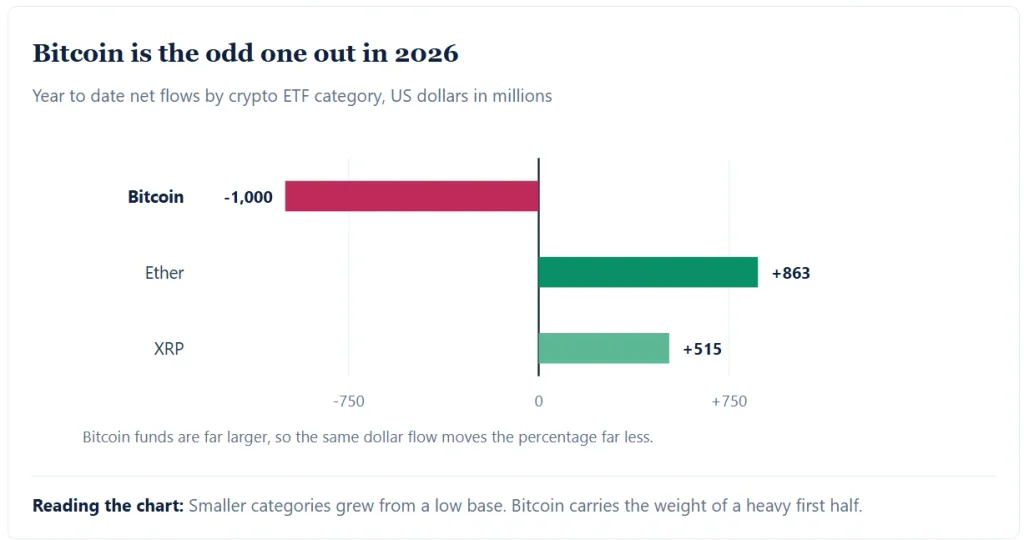
US spot bitcoin ETFs still show a 2026 net outflow of about $1bn.
Three strong weeks brought in roughly $3.8bn, the best run of the year.
The funds took $986.9m in the week to 5 September alone.
Total net assets reached $101.3bn, with $55.6bn of cumulative net inflows.
Ether and XRP funds both stayed positive for 2026, unlike Bitcoin.

US spot bitcoin funds have almost dug themselves out. Almost.
Three strong weeks pulled in about $3.8bn. Yet the 2026 net flow still sits near minus $1bn.
So the year remains a loss on the flow ledger. The gap looks small, but it has not closed.
That distinction matters more than it sounds. Flow measures fresh money, not price gains. Assets can hit records while net flows stay negative.
What the flow data shows
Investors put $986.9m into the funds in the week to 5 September. That was their strongest week of 2026.
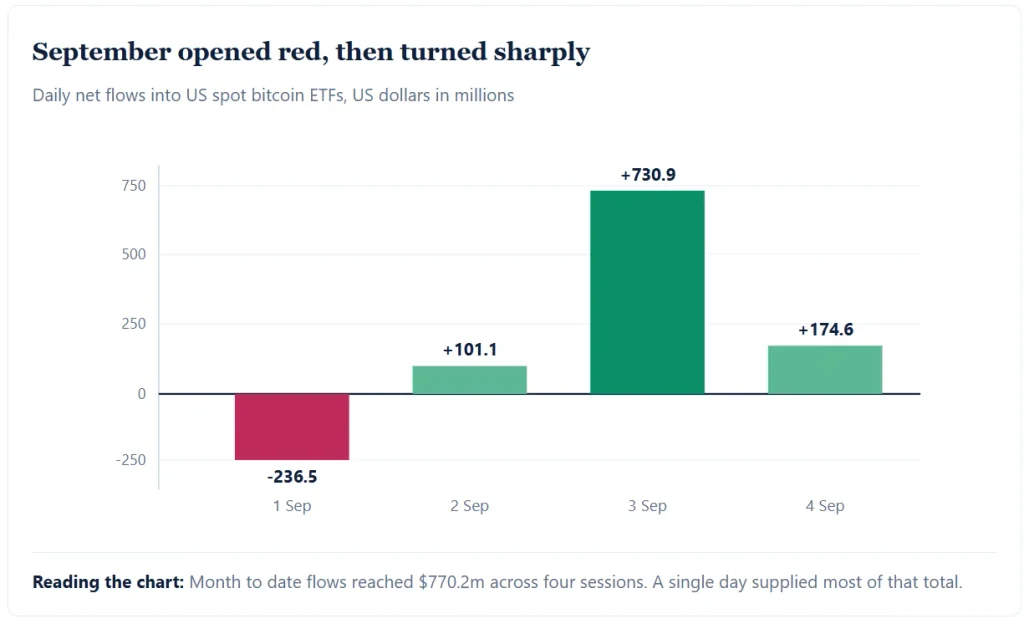
September itself started badly. The first trading day saw $236.5m leave. Three inflow days then followed in a row.
Month-to-date flows reached $770.2m by 4 September. Furthermore, the daily average ran near $192.5m.
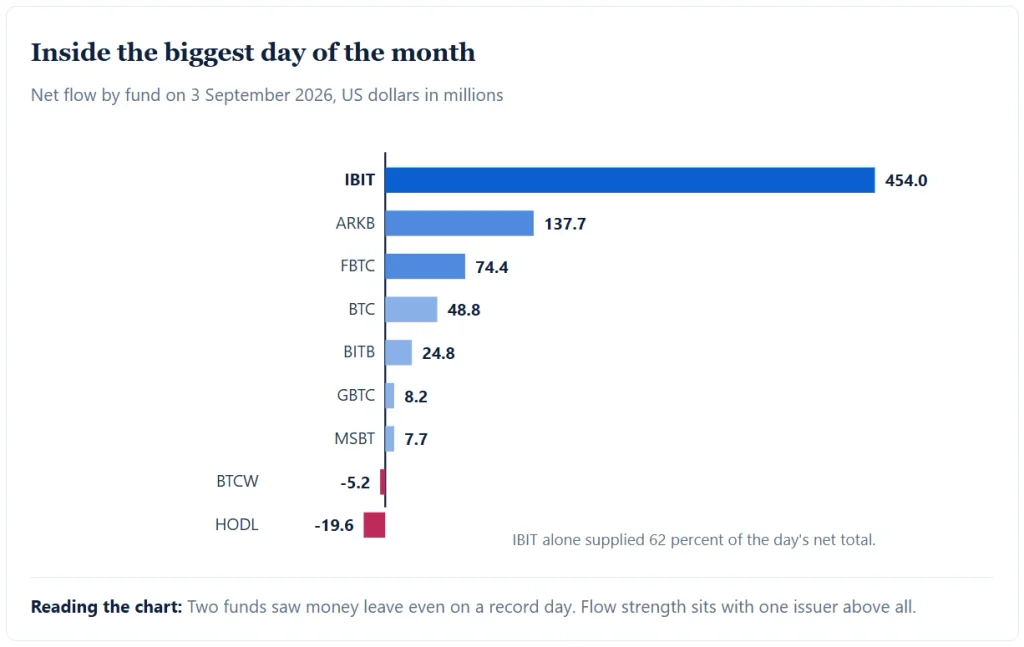
One session did most of the work. On 3 September, the funds pulled in $730.9m.
Such lumpiness is normal for this category. Large allocators trade in blocks rather than trickles. Consequently, a single mandate can dominate a week.
BlackRock still dominates the category
IBIT took $454m of that single-day total. ARK’s fund added $137.7m, while Fidelity’s took $74.4m.
Not every fund gained, though. VanEck’s HODL lost $19.6m, and WisdomTree’s product shed $5.2m.
Concentration keeps rising across the group. One issuer now sets the tone for the whole category.
That matters for market structure. A single desk’s rebalancing can swing the headline flow number. Therefore, daily readings deserve some caution.
Fee competition explains part of the gap. IBIT built early scale and kept it. Rivals now compete on cost without closing the liquidity gap.
Spreads follow assets in this business. Deeper funds trade tighter, which pulls in more institutional money. In turn, that advantage compounds.
The 2026 hole in context
Step back and the picture looks healthier. Cumulative net inflows since launch reach $55.6bn.
Total net assets stood at $101.3bn on 5 September. So these products now hold real scale.
The 2026 shortfall reflects a hard first half. Redemptions ran heavy as prices fell through the spring.
Recovering that ground would take about one more strong week. In short, the deficit is now a rounding error against total assets.
Compare the two numbers directly. A $1bn shortfall equals less than one percent of assets. Price moves swamp that on any given day.
Ether and XRP funds cooled off
Other crypto funds lost momentum last week. Ether products took $218.4m, a fall of 74 percent.
XRP funds attracted just $19m. That marked a drop of 83 percent for the week.
Year to date the contrast stands out clearly. Ether funds are up about $863m, and XRP funds are up $515m.
Among the majors, only Bitcoin funds remain negative for the year. Ironically, they are also by far the largest.
Base effects explain much of the difference. Ether and XRP products launched later and started small. By contrast, bitcoin funds had two years of flows to give back.
Size cuts both ways here. Large funds attract steady demand from advisers and pensions. They also hold the biggest positions to unwind when sentiment turns.
Price action tells a different story
Bitcoin traded near $79,000 on Tuesday. It slipped about 1.6 percent over a day.
The token peaked at $81,166 on 4 September. Resistance between $80,000 and $82,000 has held firm since.
Even so, the coin has gained roughly 22 percent since 7 August. For once, flow and price have moved together.
Sentiment has improved with it. A widely watched fear and greed gauge reads 70, in greed territory. Yet it sits well below the extremes of past rallies.
Macro still sets the ceiling
Rates explain much of the caution. Strong August payrolls lifted odds of a Federal Reserve hike toward 60 percent.
Ten-year Treasury yields sit near 4.77 percent, close to 52-week highs. Higher real yields raise the bar for assets that pay nothing.
Oil adds another headwind. Crude above $90 keeps inflation risk alive into 2027.
Therefore, the ETF bid faces a far tougher backdrop than in 2024. Buyers now compete with a decent risk-free return.
Leverage looks tame for now
Positioning offers some comfort here. Open interest fell 2.4 percent to about $53bn.
Liquidations stayed small at $5.75m over a day. Long positions made up 83 percent of that figure.
Funding rates ran near 2.35 percent annualised. Such levels suggest measured risk-taking rather than froth.
Compare that with earlier cycles. Funding above 20 percent once signalled crowded longs. Today’s readings look almost sober by comparison.
Lower leverage also changes the downside. Forced selling drove the sharpest drops of 2025. Without it, corrections tend to be shallower.
What to watch next
Three markers matter now. First, whether flows stay positive through mid-September. Second, whether the 50-day average crosses above the 200-day one. Third, how the funds behave around the Federal Reserve meeting.
That crossover was due around 11 September. Chart signals rarely decide much on their own, of course.
Flow data will settle the year. One more week like the last would erase the 2026 deficit outright.
The Federal Reserve remains the wider swing factor. A September hike would lift real yields again. In that case, the recent bid could fade as fast as it arrived.