

August 24, 2026 – A sharp two-day rally stalled below $79,511. Traders now watch a narrow trigger band and a tight invalidation level below $75,200.
In Summary
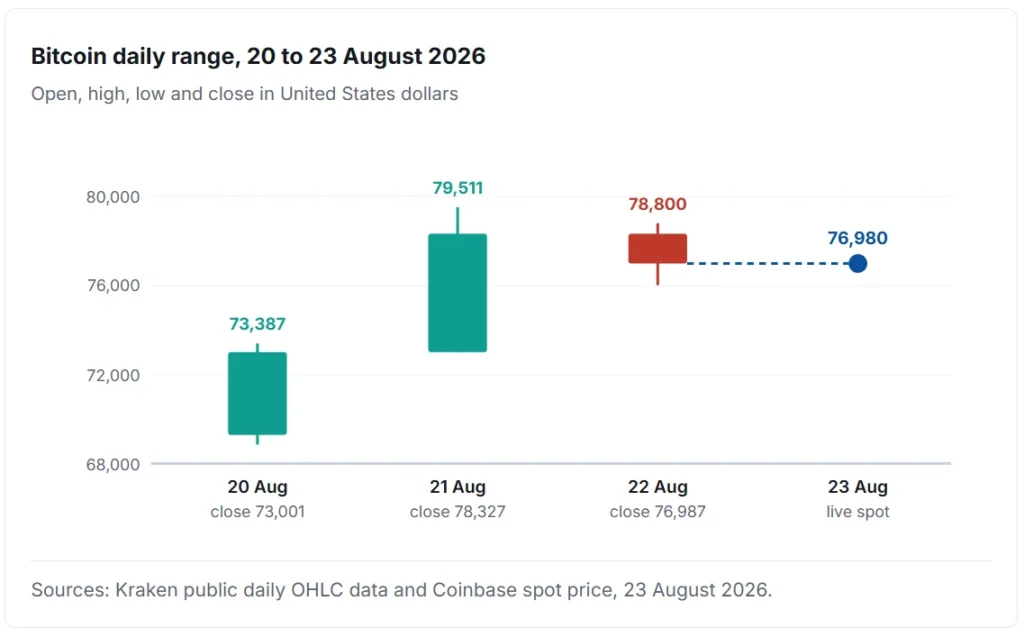
Bitcoin traded near $76,980 on 23 August, after peaking at $79,511 on 21 August.
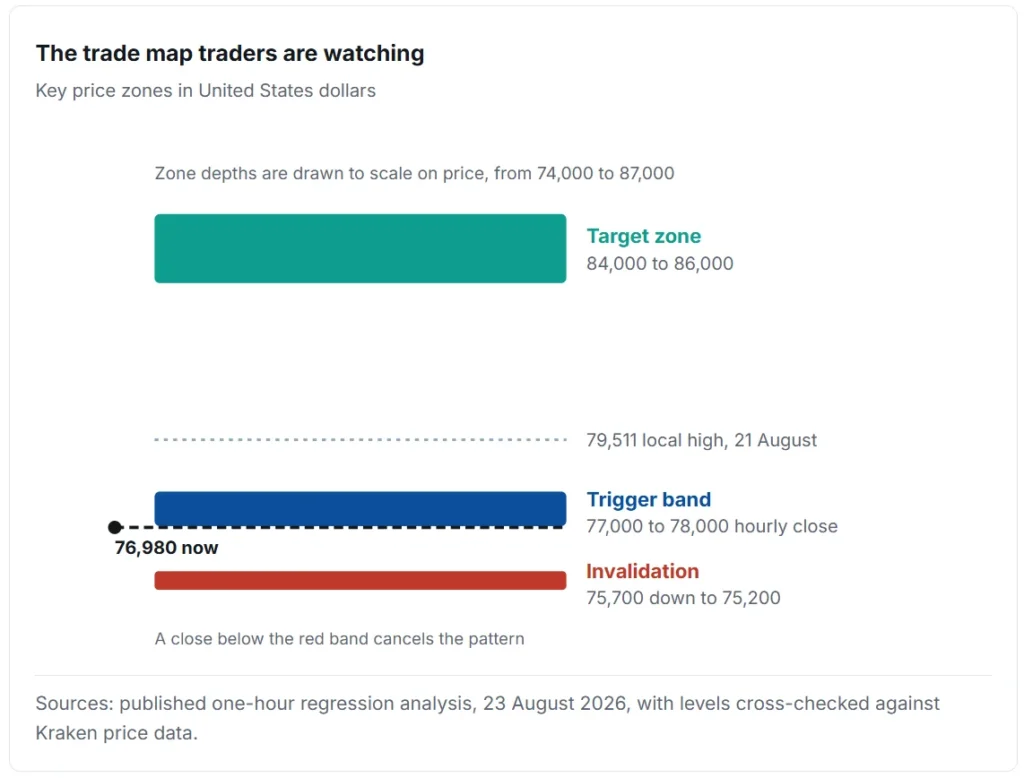
A one-hour bull flag points toward the $84,000 to $86,000 zone.
The pattern needs a decisive hourly close above roughly $77,000 to $78,000.
A loss of $75,200 would invalidate the setup and reopen downside risk.
Network hash rate sits near 875 exahashes, with difficulty at 125.8 trillion.
Bitcoin is consolidating after its sharpest two-day advance of the quarter. The asset changed hands near $76,980 on 23 August 2026. That level sits about 3% below the recent peak of $79,511. Traders now debate whether the pause marks a pattern or a top.
Meanwhile, the technical case rests on a bull flag visible on the one-hour chart. Its flagpole runs from below $70,000 up to $79,511. Since then, the price has drifted inside a downward-sloping regression channel.
The trigger sits in a narrow band
Activation requires a decisive hourly close above the upper regression boundary. That boundary currently runs through the upper $77,000 area toward $78,000. Until price clears it, the flag remains a pattern rather than a signal.
Above that band, and only there, the projected move targets $84,000-$86,000. Below it, the setup weakens quickly. A break under $75,700 would warn of failure. Losing $75,200 on a closing basis would cancel the structure outright.
Asymmetry favours the patient
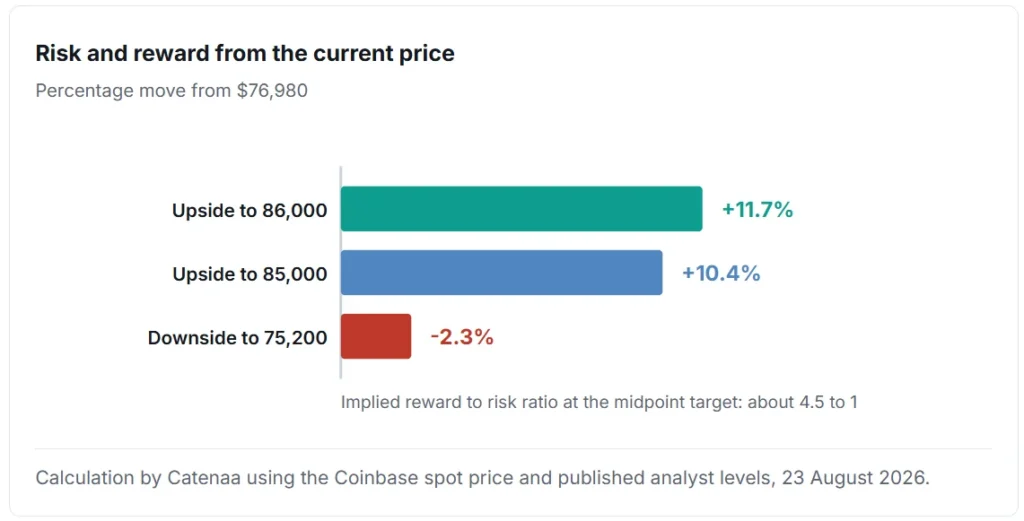
The structure offers an unusually tight risk profile. From $76,980, the midpoint target of $85,000 implies a 10.4% gain. By contrast, invalidation at $75,200 sits only 2.3% lower. That ratio approaches four and a half to one.
However, tight stops cut both ways. Volatility of this magnitude can sweep a 2% band within minutes. Therefore, position sizing matters more than direction here.
How the rally was built
The move began with a breakout above $65,050 on 19 August. Price then recovered to the $69,000 to $70,000 area. On 21 August, buyers pushed from $73,001 to $79,511 in a single session. Kraken recorded 6,536 bitcoin of volume that day.
Momentum cooled immediately afterwards. The 22 August session closed lower at $76,987 on 2,974 bitcoin. Lighter volume during consolidation usually supports the flag reading.
Network fundamentals stay firm
Underlying network data offers a steadier backdrop. Hash rate sits near 875 exahashes per second. Mining difficulty stands at roughly 125.8 trillion. Block height has also passed 963,600.
The next difficulty retarget is estimated at about minus 3.6%. Its previous adjustment came in at-1.3%. Easier difficulty tends to relieve pressure on miner margins. Consequently, forced selling from that cohort should ease modestly.
Intraday tape stays two-sided
Kraken data shows a 24-hour high of $77,525 and a low of $75,568. The volume-weighted average price sits near $76,839. Price therefore trades close to the session average, which signals balance rather than trend.
Reported network market prices cluster around $77,300 across venues. Small gaps between exchanges reflect regional flows. Traders should nonetheless price in slippage near the trigger band.
What could break the setup
Three risks stand out for traders this week. First, a failed hourly close above $78,000 would extend the range. Second, thin weekend liquidity can exaggerate any move. Third, macro headlines remain the dominant swing factor.
The longer-term projection cited by analysts reaches roughly $148,000 by summer 2027. That path assumes the current structure holds. Nevertheless, short-term traders should treat $75,200 as the line that matters now.