
One number tries to capture how millions of investors feel. Here is how it works and why it matters.
In Summary
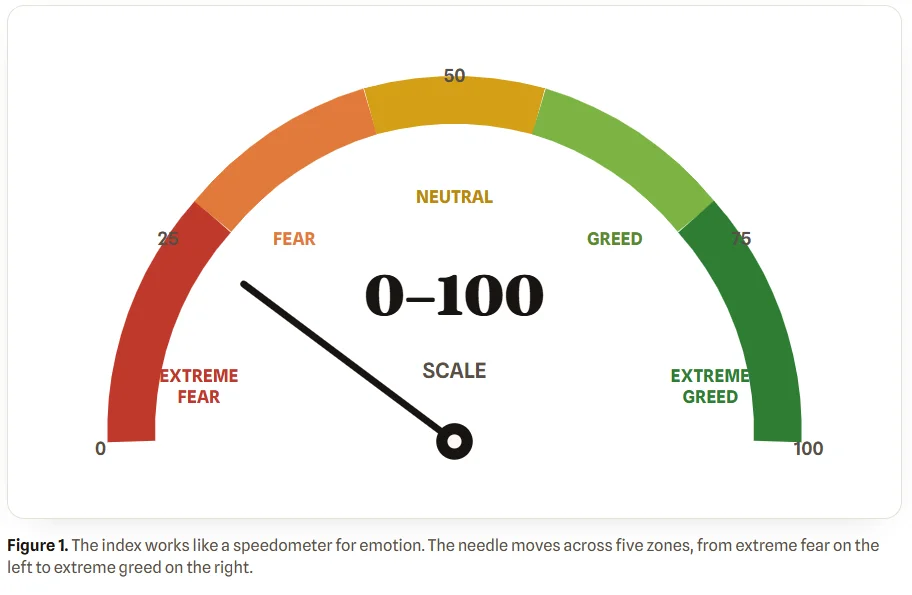
The index scores market emotion from 0 (extreme fear) to 100 (extreme greed).
CNN’s stock version blends seven equally weighted signals; crypto versions use six.
Low scores hint at fear and possible value; high scores hint at greed and possible froth.
Contrarians try to buy fear and sell greed, yet timing the swings stays tricky.
Treat the index as context, not as a forecast or as financial advice.
Markets run on numbers. Yet they also run on emotion. Two feelings tend to dominate: fear and greed. When greed takes over, investors chase rising prices. When fear spreads, they rush for the exit. The Fear and Greed Index turns these emotions into a single score. As a result, it offers a quick read on the market’s mood.
This guide explains what the index measures. Moreover, it shows how the stock and crypto versions differ, and how careful investors actually use the tool.
What Is the Fear and Greed Index?
The Fear and Greed Index is a sentiment gauge. In short, it measures whether investors feel fear, neutrality, or greed. The score runs from 0 to 100. A low number signals fear, while a high number signals greed.
CNNMoney launched the original stock-market version in spring 2012, soon after the global financial crisis. Today CNN Business maintains it. Meanwhile, crypto markets built their own versions because digital assets swing even harder on emotion.
The logic behind the tool is simple. Fear can push prices below fair value. Greed can lift them above it. Consequently, extreme readings often flag potential turning points.
The timing of its launch also mattered. Investors had just lived through a crash, so trust felt fragile. A single mood score gave readers a friendly way to track that fragile trust. Since then, the format has spread far beyond CNN.
Why Emotion Moves Markets
Prices reflect facts such as earnings, interest rates, and growth. However, they also reflect feelings. Investors are human, so they react to crowds. When everyone buys, the fear of missing out grows. When everyone sells, panic spreads quickly.
The index captures this herd behaviour in one figure. Therefore, it helps traders spot emotional extremes. Both stock and crypto versions share the same 0-100 scale, making them easy to compare at a glance.
Consider a simple example. Suppose good news lifts a stock for several days. Other investors notice the climb and pile in. Prices then rise faster than profits justify. At that point, the gauge drifts toward greed. Eventually, the crowd thins, and the trend can reverse.
The Seven Ingredients of the Stock Version
CNN’s stock index blends seven market signals into one number. Notably, each signal carries equal weight, as the segmented bar below shows.
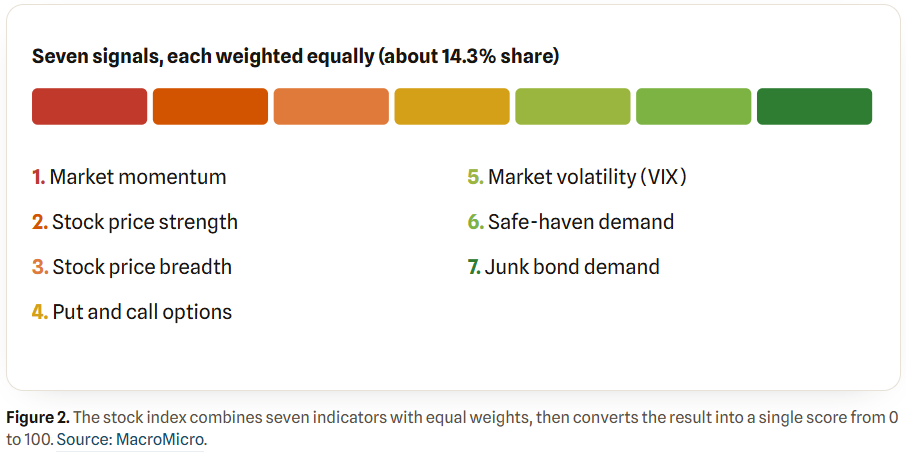
Each signal reveals a different habit. Momentum tracks the trend. Strength and breadth show how broad a rally really is. Options and volatility expose nervousness. Safe-haven and junk-bond demand reveal an appetite for risk. Together, they show how investors behave, not just what they say.
The Crypto Version
Crypto traders adapted the idea for a faster, wilder market. The popular alternative.me index was the first of its kind. It tracks six factors: volatility, market momentum and volume, social media buzz, surveys, Bitcoin dominance, and Google search trends.
These inputs suit crypto well. After all, prices there can move 20% in a single day on sentiment alone. As a result, the crypto gauge reacts faster and swings more widely than its stock cousin.
Several providers now publish their own crypto versions. Each one weighs the factors slightly differently. Because of that, readings can vary by a few points across sites. Even so, the broad story usually agrees. When fear grips the market, most gauges fall together.
Reading the Mood Right Now
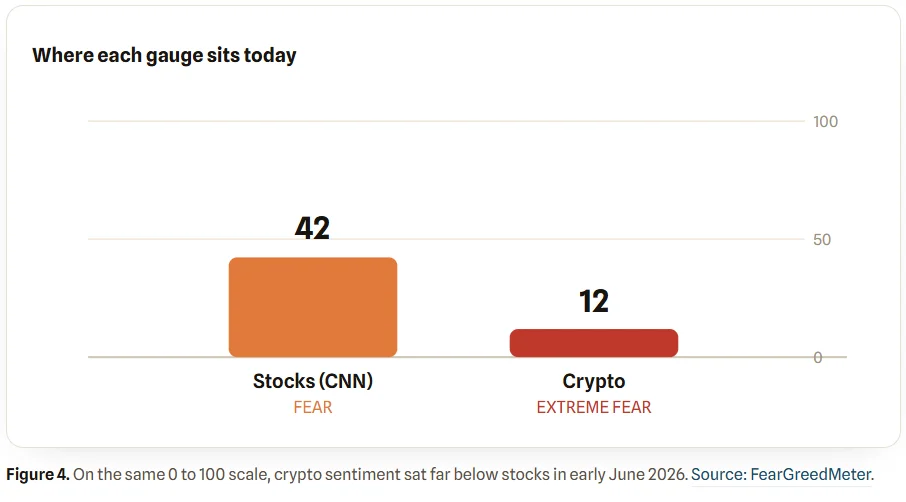
Sentiment looked shaky in early June 2026. CNN’s stock index sat at 42, or fear, on June 5. The crypto gauge looked far gloomier. It fell to 12, extreme fear, on June 6, its lowest level in weeks.
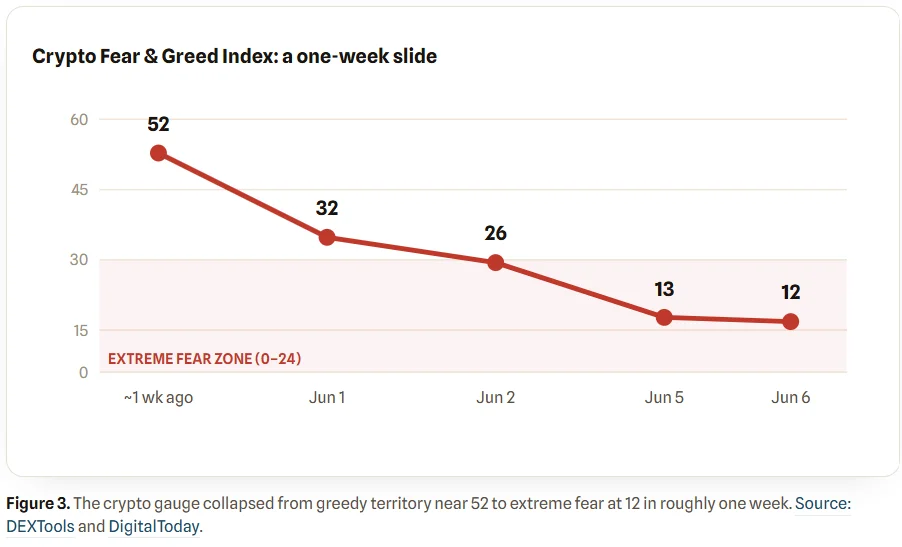
The crypto slide was dramatic. Indeed, only a week earlier the index sat near 52, inside greedy territory. Then Bitcoin slid toward $61,100, and mood collapsed. The chart below compares both gauges side by side.
How Investors Actually Use It
Many investors treat the index as a contrarian signal. Warren Buffett summed up the idea well: be fearful when others are greedy, and greedy when others are fearful.
History offers vivid examples. The crypto gauge hit 84 on November 9, 2021, just one day before Bitcoin peaked near $69,044. Greed had reached a boiling point. Months later, the same gauge sank to 6 on June 19, 2022, during a brutal bear market. Patient buyers later found value at those lows.
Still, timing remains hard. Extreme readings can persist for weeks. Therefore, the signal works better as context than as a precise trigger.
The Catch
The index is a thermometer, not a crystal ball. It describes today’s mood. However, it cannot forecast tomorrow’s prices. Sentiment can stay fearful while prices keep falling. Likewise, greed can run for months without a crash.
For that reason, smart investors treat the index as one input among many. They pair it with fundamentals, valuation, and a clear personal plan. Used that way, the tool adds useful perspective. Used alone, it can mislead.
Where to Find It
Checking the index costs nothing. CNN publishes its stock gauge free on its markets page. For crypto, sites such as alternative.me, CoinMarketCap, and Binance update readings daily. Most show the score, the zone, and a short history.
Beginners can start with one trusted source. Then, over time, they can compare a few gauges. This habit builds a feel for how mood shifts. Above all, the number works best as a conversation starter, not as a command.