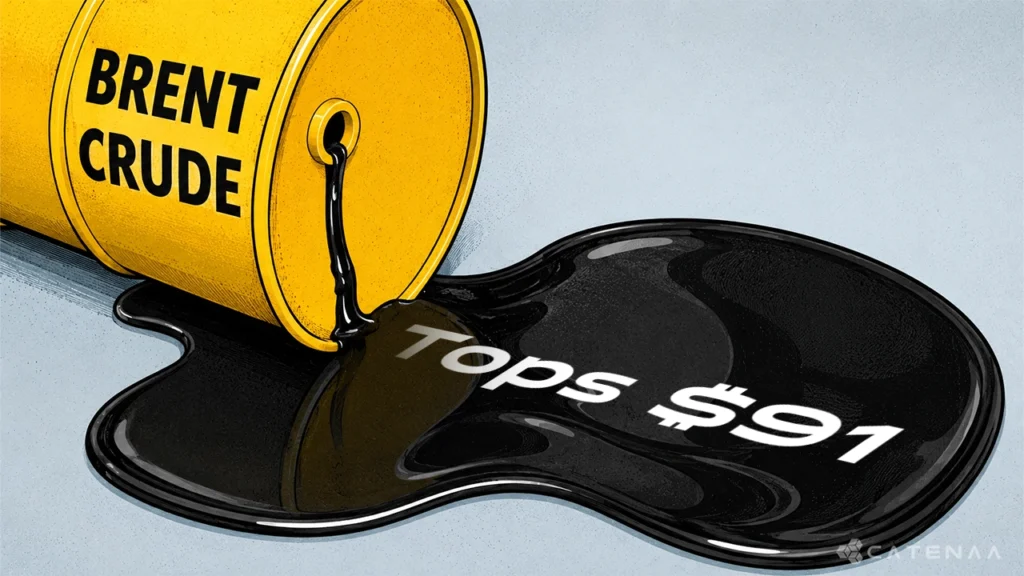


August 19, 2026 – Energy leads every asset class this year. Meanwhile, gold and silver still trade far below the peaks they set in January.
In Summary
Brent closed at $91.33 a barrel, up 50.1% so far this year.
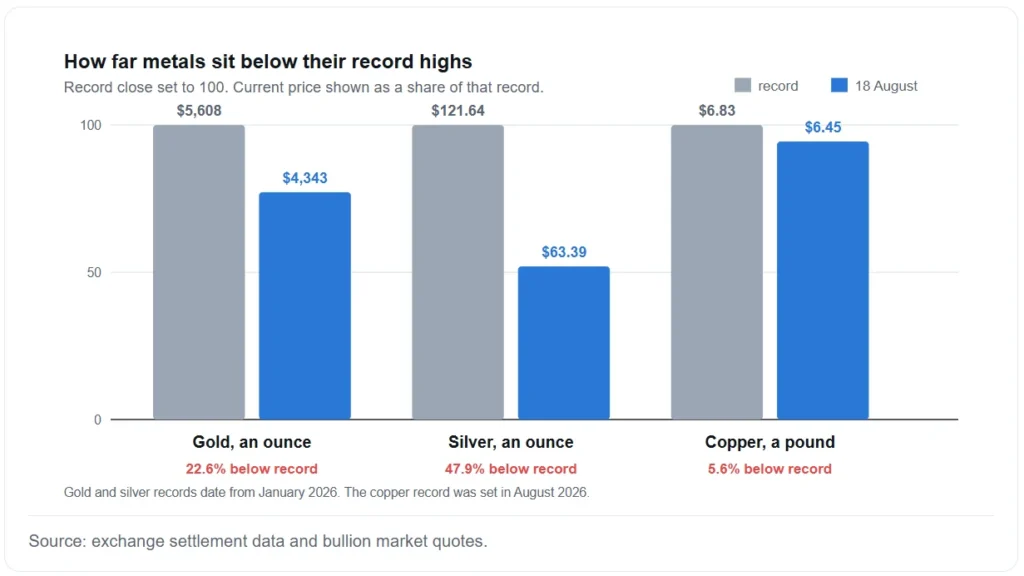
Copper touched a record $6.83 a pound this month before easing to $6.45.
Gold sits 22.6% below its January record of $5,608 an ounce.
Silver trades 47.9% under its January peak, yet remains 74% higher year on year.
Seven OPEC+ members will trim output by 188,000 barrels a day in September.
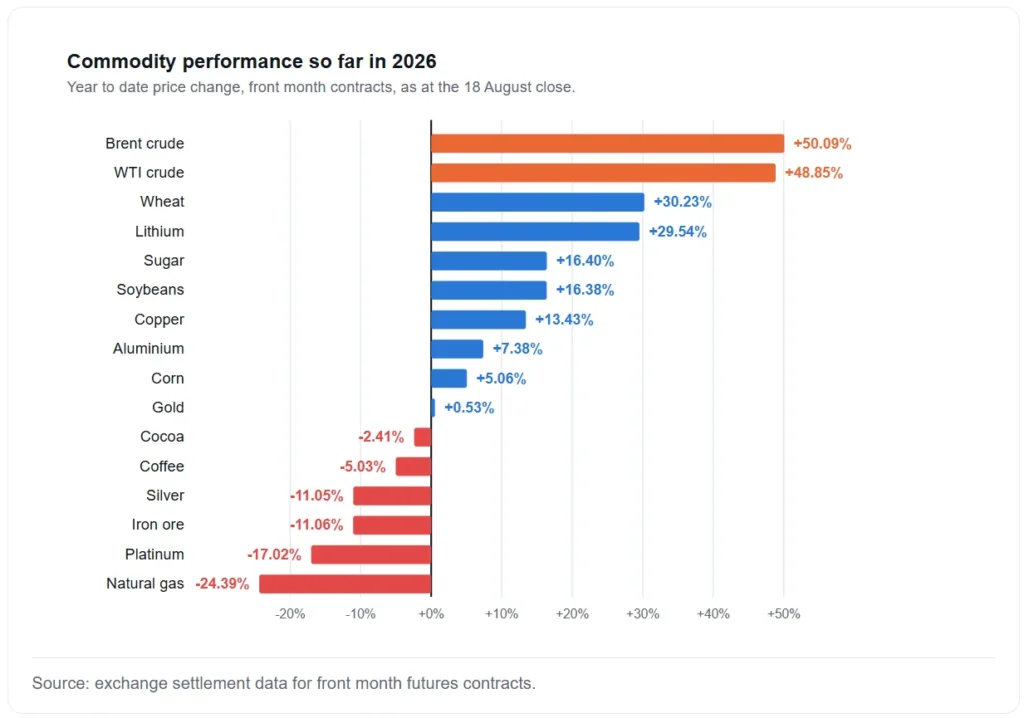
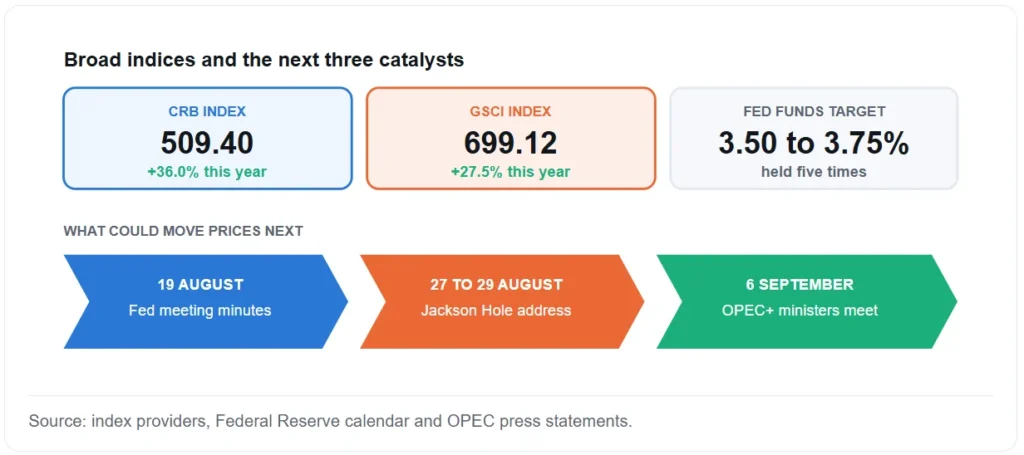
The CRB index is up 36.0% in 2026, while natural gas has lost 24.4%
Energy runs the table
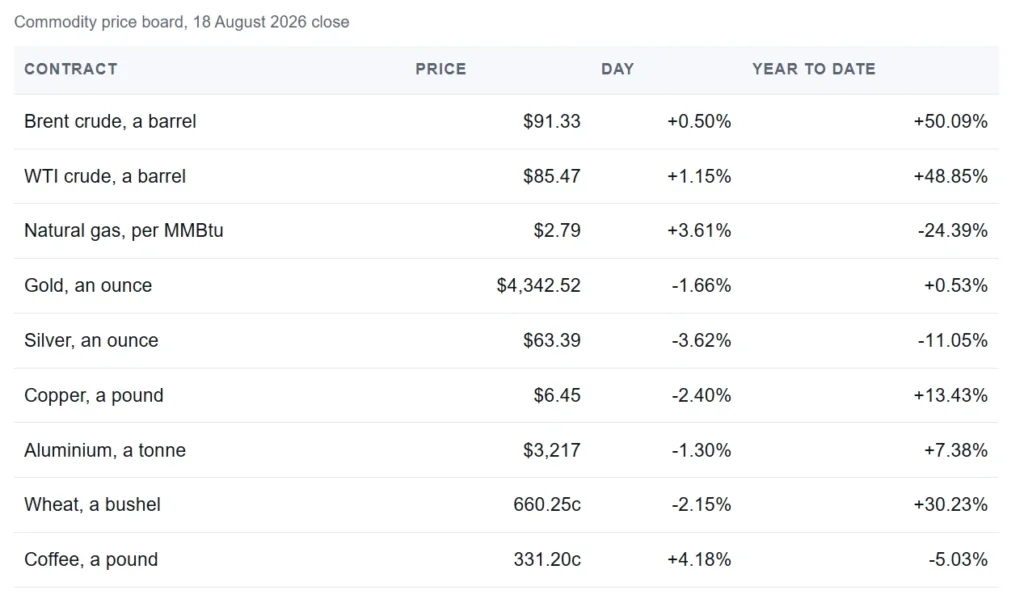
Global commodity markets no longer move as one trade. Brent crude settled at $91.33 a barrel on 18 August, up 0.5% on the day. That leaves the benchmark 50.1% higher in 2026. West Texas Intermediate closed at $85.47, a gain of 48.9% over the same stretch.
Broad baskets confirm the tilt toward energy. The CRB index sits at 509.40, up 36.0% this year. Meanwhile, the GSCI reads 699.12, a rise of 27.5%. Both gauges carry heavy fuel weightings, so both flatter the wider picture.
Yet the average hides a wide split. Natural gas has lost 24.4% since January. Platinum is down 17.0% and iron ore is down 11.1%. In short, one index now holds two very different markets.
Oil carries a war premium
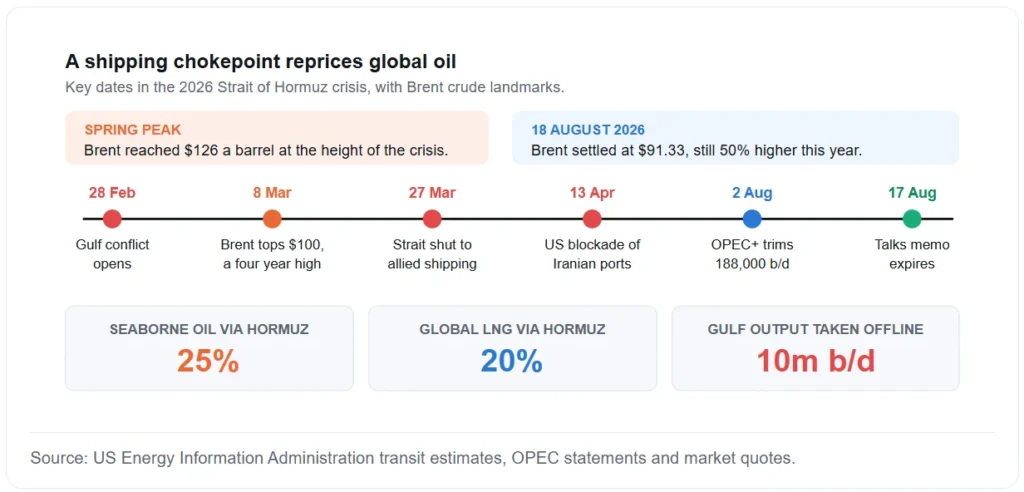
Geopolitics explains most of the energy moves. Shipping through the Strait of Hormuz has been disrupted since late February. Roughly a quarter of seaborne oil trade and a fifth of global liquefied natural gas normally pass through that channel.
Tanker traffic fell about 70% within days of the first attacks on merchant ships. Later, it dropped close to zero. Gulf producers took at least 10 million barrels a day offline at the worst point. Brent peaked near $126 during the spring.
Conditions have eased since then, although not fully. A United States naval blockade of Iranian ports remains in force. Vessels still report attacks in the area. Moreover, a memorandum covering peace talks expired on 17 August, which lifted prices again.
Exporters have adapted where they can. Saudi Arabia now offers cargoes loaded outside the strait. Similarly, the United Arab Emirates routes barrels through its own pipeline to the Gulf of Oman.
OPEC+ pulls barrels back
Supply policy turned tighter this month. Seven producers agreed on 2 August to trim 188,000 barrels a day from September. Saudi Arabia, Russia, Iraq, Kuwait, Kazakhstan, Algeria, and Oman all signed the pledge.
The group framed the step as support for “oil market stability”. Furthermore, it lets members catch up on past overproduction since January 2024. Ministers review the plan again on 6 September.
The cut looks small against the world’s demand. Even so, it removes an easy source of relief while Hormuz stays unsettled.
Precious metals nurse a hangover
Gold and silver tell the opposite story. Bullion closed at $4,342.52 an ounce on 18 August. That price sits 22.6% below the record of $5,608 set in January. Gold is therefore flat for 2026, ahead by just 0.5%.
Silver looks worse against its own peak. The metal trades at $63.39, some 47.9% under January’s $121.64. However, both metals remain far above year earlier levels. Gold has gained 30.3% over twelve months, and silver 74.2%.
Two forces pull in opposite directions. Long-dated bond yields have climbed hard, with the 30-year Treasury at a 19-year high. High yields hurt an asset that pays no income. On the other side, central banks keep buying. Official purchases reached 289 tonnes in the second quarter, up 62% on the year.
Copper writes its own story
Industrial metals have followed a separate path. Copper reached a record $6.83 a pound this month. Prices then slipped to $6.45, a two-week low, as traders banked profits.
Supply keeps the floor firm. Chile expects output to fall 2.6% this year. Chinese refined production is easing too, because concentrate and scrap both remain scarce.
Demand looks softer at these levels. The Yangshan import premium fell to $96 a tonne from $115 a month earlier. That drop signals a thinner Chinese buying appetite. Aluminium has added 7.4% this year, while lithium has jumped 29.5%. By contrast, iron ore has lost 11.1% as steel output cools.
Farm goods pull apart
Agriculture shows the same spread. Wheat leads the group with a 30.2% gain. Higher fuel and freight costs feed straight into grain prices, so the move tracks energy closely. Soybeans have added 16.4% and sugar 16.4%.
Soft commodities have lagged badly. Coffee is down 5.0% and cocoa is down 2.4%. Corn has managed only 5.1%. Therefore, the farm complex gives little extra lift to the wider index.
What the split means for portfolios
Investors often treat commodity markets as a single hedge. This year proves the label is too broad. An energy-heavy basket has beaten equities comfortably. A metal-heavy basket has not.
Correlation has also broken down inside sectors. Copper trades on Chinese demand and mine supply. Gold trades on real yields and official buying. Both wear the same “metals” tag, yet they answer to different masters.
Currency effects add another layer. Most contracts settle in dollars, so exchange rates shift returns for buyers elsewhere. In addition, freight and insurance costs have risen sharply on Gulf routes.
What sets the next move
Three dates matter over the coming fortnight. Federal Reserve minutes arrive on 19 August. Chair Kevin Warsh then speaks at Jackson Hole between 27 and 29 August. Finally, OPEC+ ministers meet on 6 September.
Rates drive metals hardest. Should Warsh sound relaxed about inflation, gold would probably find fresh buyers. Supply drives oil instead. Any credible calm at Hormuz could unwind a large slice of the current premium.
For now, commodity markets stay split. Energy carries the index, industrial metals track China, and precious metals wait on the Fed.