


August 01, 2026 – Both giants beat forecasts on the same night. One gained 15%, the other shed $472 billion. The bond market, not the earnings, decided which was which.
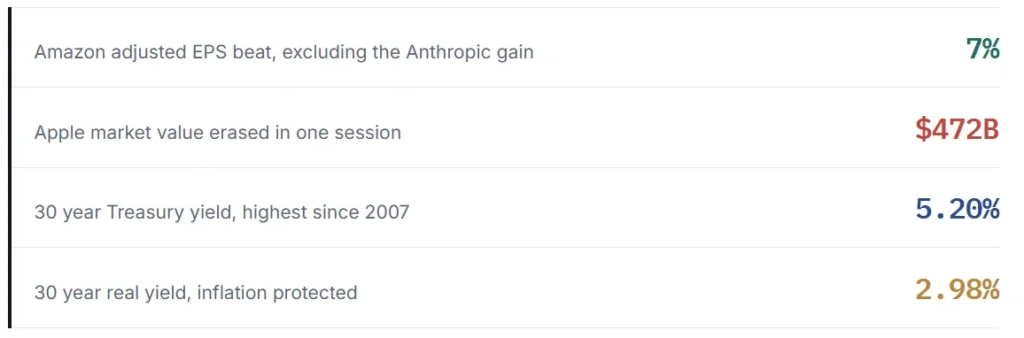
Amazon and Apple earnings landed on the same evening and split the market in two. Both companies beat Wall Street forecasts. However, investors rewarded one and punished the other. Amazon stock climbed about 15% on Friday. Apple fell roughly 9.7% and gave up close to $472 billion in market value.
That gap looks odd at first glance. Apple grew revenue 16% and set a June quarter record. Amazon, by contrast, posted a headline profit that flattered its true operating result. So the market appears to have paid up for the weaker number.
The bond market explains the puzzle. Long-term real yields now sit near two-decade highs. Therefore, investors pay up for demand they can see this year. They mark down promises that arrive much later.
In Summary
Amazon’s $5.75 EPS is not an operating number. A $53.4 billion pre-tax gain, mostly from its Anthropic stake, drove it. Adjusted earnings land near $1.95.
Apple beat and still lost about $472 billion. Weak September guidance, not the quarter itself, triggered the selling.
Greater China grew 22.4%. It missed forecasts. It did not decline.
The 30-year Treasury closed at 5.20%, its highest since 2007. Real yields make up 57% of that level.
Three Fed officials dissented for a hike, the first such unified split since 2016.
Amazon’s headline profit needs a second look
Amazon reported net income of $62.6 billion, or $5.75 per diluted share. Consensus sat near $1.82 per share. Yet that comparison mixes two very different things.
Amazon’s own release shows non-operating pre-tax income of $53.4 billion. Most of it came from a revaluation of its Anthropic stake. In other words, the gain reflects a mark-to-market move. It does not reflect cloud sales.
Strip that gain out and the picture shifts sharply. Catenaa applied Amazon’s 22.5% effective tax rate to the remaining pre-tax income. Adjusted earnings then land near $1.95 per share. The beat therefore shrinks from 216% to roughly 7%.
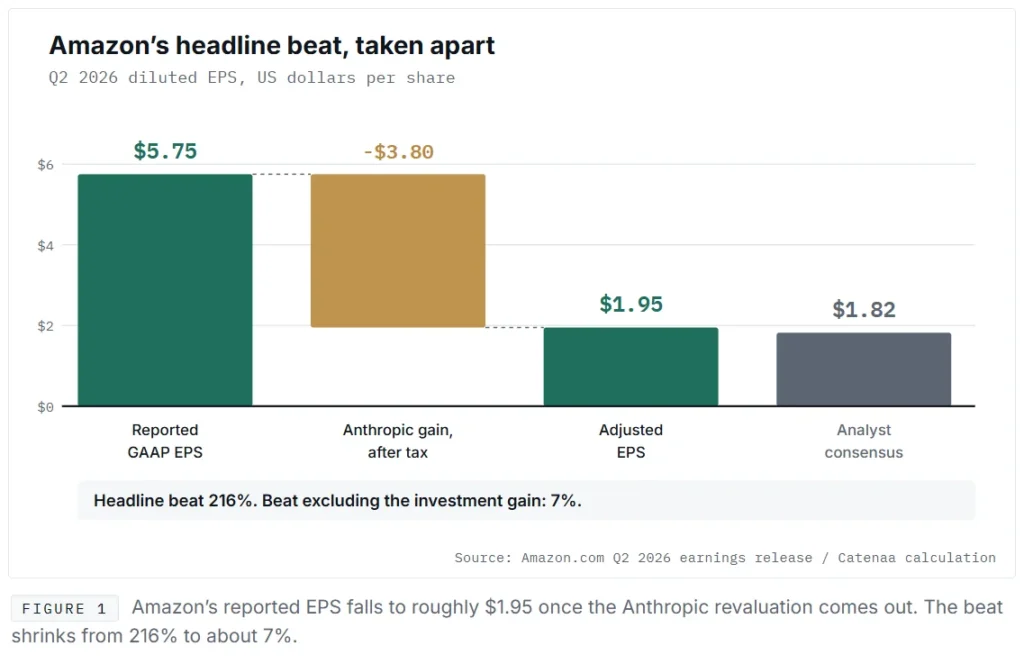
That distinction matters for anyone reading the tape quickly. A 216% beat implies a step change in the business. Meanwhile, a 7% beat implies a good quarter with solid execution. Only one of those readings survives contact with the filing.
The operating story still looks genuinely strong. AWS revenue rose 37% to $42.2 billion. That marks its fastest pace in 18 quarters. Furthermore, AWS operating margin widened to 39.4% from 32.9% a year earlier.
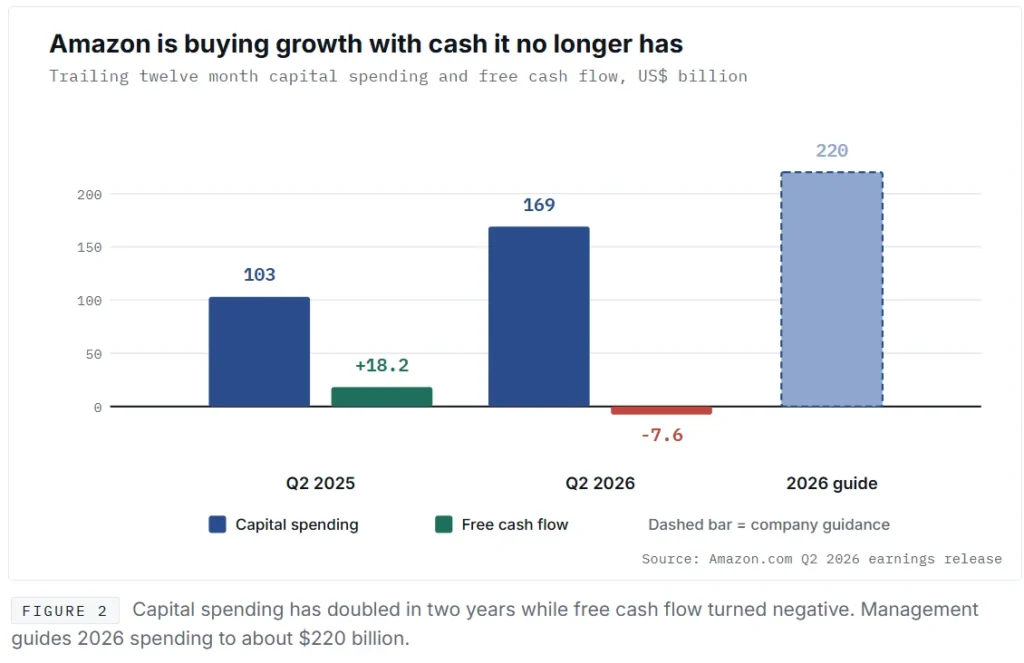
Yet the balance sheet carries the cost of that growth. Trailing capital spending reached $169.0 billion, up 64%. Free cash flow swung to an outflow of $7.6 billion. A year earlier it showed an inflow of $18.2 billion.
Debt tells a similar story. Long-term borrowings nearly doubled in six months to $128.9 billion. Meanwhile, chief executive Andy Jassy guided capital spending toward roughly $220 billion this year. Total assets crossed $1.1 trillion for the first time.
Apple grew fast and still lost $472 billion
Apple’s quarter beat on almost every visible line. Revenue rose 16% to $109.4 billion. iPhone revenue jumped 21.7% to $54.3 billion. Mac climbed 28.7% to $10.4 billion.
One widely repeated claim needs correcting here. Greater China did not shrink. Revenue there rose 22.4% to $18.8 billion. It simply came in below what analysts wanted.
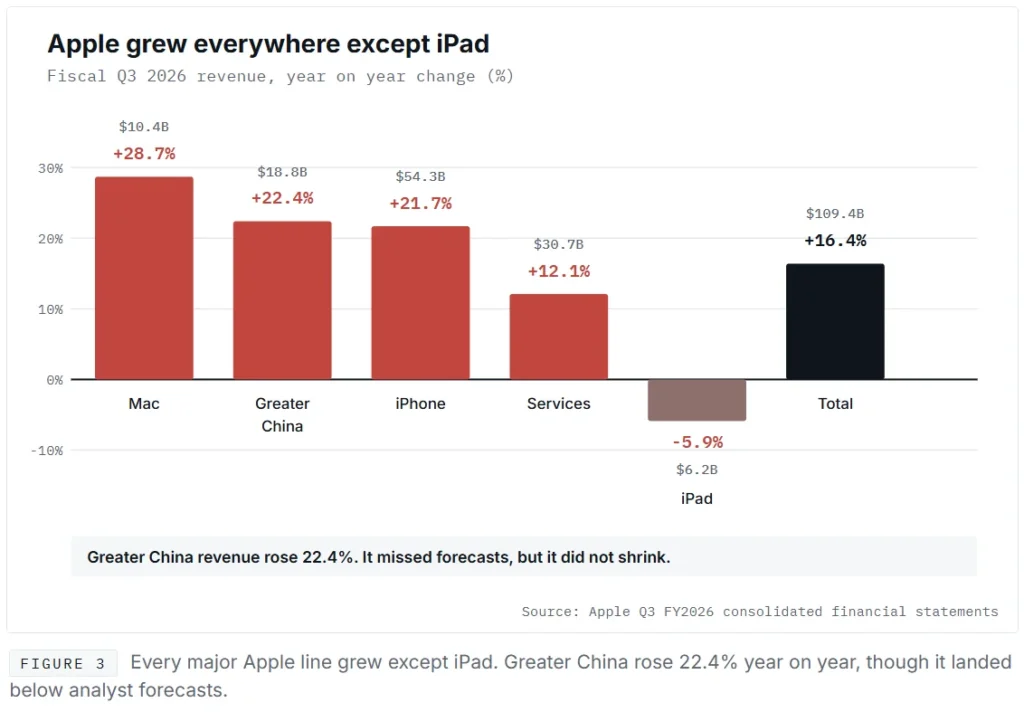
Services told a softer story. Revenue grew 12.1% to $30.7 billion. That made it the slowest major line in the quarter. Investors treat Services as the engine of Apple’s valuation multiple.
Apple’s margin also flattered the headline result. Gross margin hit 50.1%. However, tariff refunds added roughly two percentage points. Those refunds also added $0.11 to earnings per share. Underlying earnings therefore sit closer to $1.91.
Then came the guidance that moved the stock. Apple guided September quarter revenue growth of 9% to 11%. Analysts wanted about 12%. Management also guided gross margin down to 47% to 48%.
Two pressures drive that forecast. A memory chip shortage is lifting component costs across the industry. Currency moves add a further headwind. Inventories confirm the squeeze, nearly doubling since September to $11.1 billion.
Why the Amazon Apple earnings gap is a rates story
Both reports contained a sizeable one-off boost. Amazon leaned on an investment gain. Apple leaned on tariff refunds. Consequently, the market reaction did not turn on trailing results at all.
It turned on what each company promised next. The Federal Reserve set that backdrop. Policymakers held the federal funds target at 3.5% to 3.75% on a 9 to 3 vote. Notably, all three dissenters wanted a quarter-point hike.
Three officials last dissented in one direction in September 2016. Such unity among hawks signals a committee under real pressure. Markets read it that way immediately.
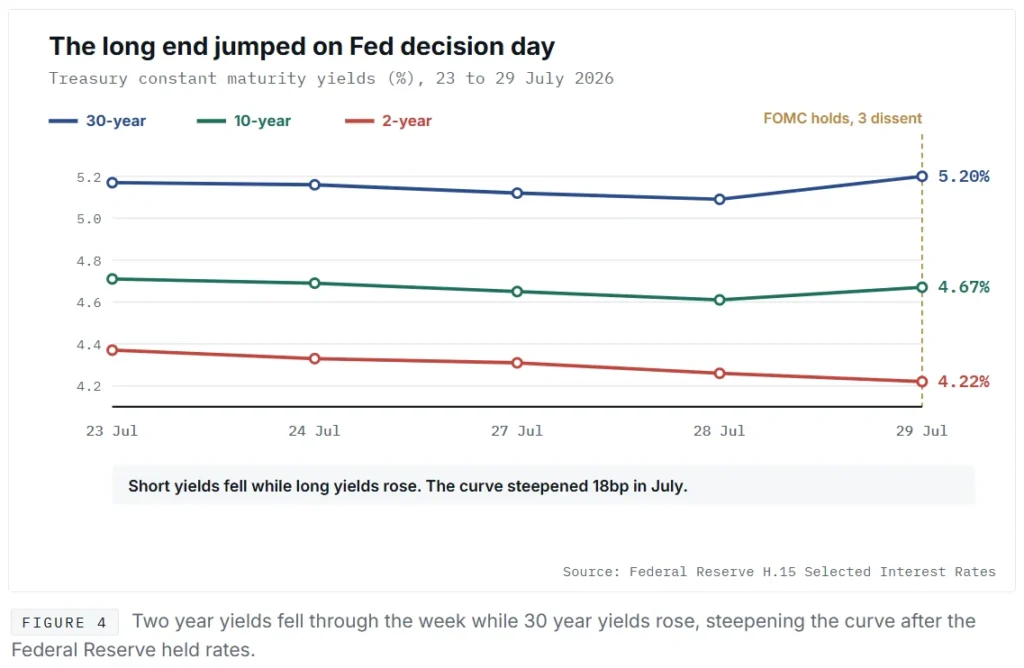
Long yields moved after the decision. The 30-year Treasury constant maturity closed at 5.20%. That is its highest level since 2007. The 10-year reached 4.67%.
Here the underlying detail matters most. Inflation compensation stayed remarkably calm. The 30 year breakeven rate sat at just 2.22%. Meanwhile, the 30-year inflation-protected yield reached 2.98%.
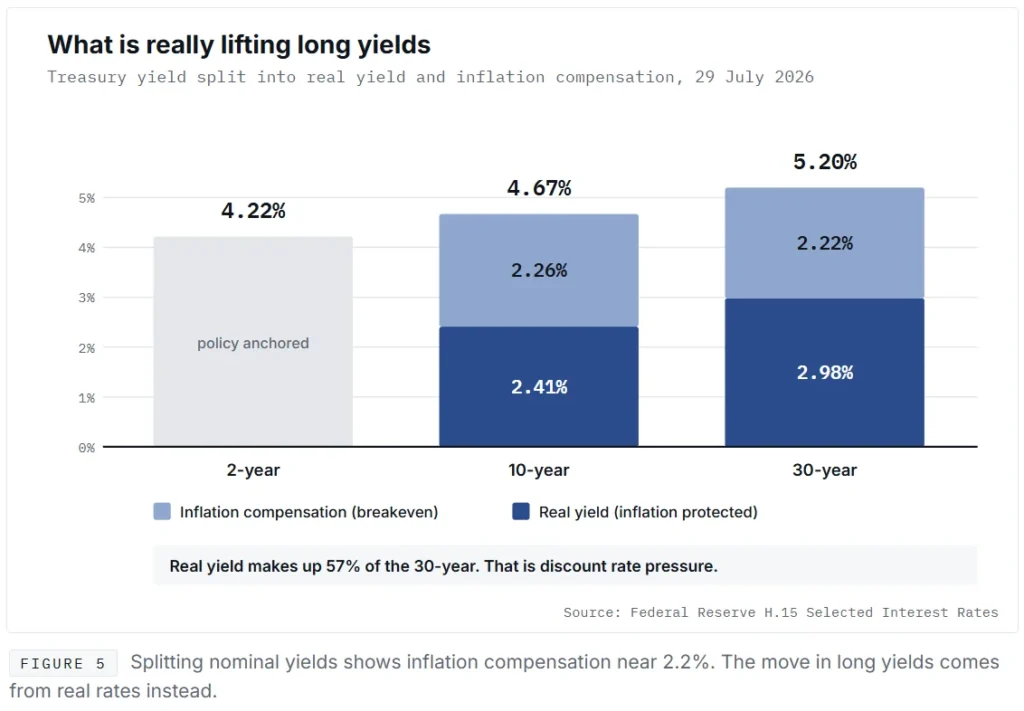
Real yields therefore make up about 57% of the long bond. Investors are not demanding shelter from inflation. Instead they want a higher real return for waiting. That is a discount rate story, not an inflation story.

Such a shift punishes long duration equity above all else. Apple sells a slow, steady stream of future service revenue. Rising real yields shrink the present value of that stream. Amazon, by contrast, showed a demand signal landing right now.
The arithmetic here is simple enough. Every extra point of real yield cuts the value of distant cash flows hardest. A dollar promised in ten years loses far more than a dollar earned today. Consequently, guidance now carries more weight than results.
That logic explains the whole session. Apple guided below consensus and lost nearly half a trillion dollars. Amazon showed accelerating demand and gained. Neither move tracked the quarter each firm had just delivered.
What this means for risk assets
The read across reaches well beyond these two names. Higher real yields lift the hurdle for every long duration asset. Growth equities, private credit and digital assets all sit in that bucket. Crypto markets in particular trade as high-beta duration.
Still, Amazon carries its own duration risk. Negative free cash flow and fast-rising debt both depend on future cloud demand. Should AWS growth cool, the same discount rate logic will apply. Investors would then question the $220 billion spending plan.
Apple faces a narrower problem. Component costs and currency should ease over time. Its installed base and pricing power remain intact.
Three things deserve attention next. First, the Federal Reserve meets again on 15 and 16 September. Second, Apple must defend margins under incoming chief executive John Ternus. Third, Amazon must convert record capital spending into cash.
Above all, this session revealed a clear new rule. Markets now price the cost of waiting. They no longer simply reward the size of the last quarter.
Editorial note on the numbers
- Widely circulated coverage compared Amazon’s $5.75 GAAP EPS with a $1.82 consensus built on an adjusted basis. Those two figures are not comparable. Catenaa restates the adjusted result at about $1.95 per share, using the 22.5% effective tax rate in Amazon’s filing.
- Reports describing a Greater China “miss” can read as a decline. Apple’s statements show Greater China revenue rising 22.4% to $18.8 billion. The shortfall sits against forecasts only.
- The $472 billion figure is a Catenaa calculation: 14.609 billion shares outstanding multiplied by the move from $333.43 to $301.13.
Disclaimer. Catenaa produced this analysis from primary filings and official statistical releases listed above. Prices, index levels, yields and market values move quickly. Refresh the share prices, the $472 billion market value figure and all yield levels before publication. Adjusted earnings per share, breakeven inflation rates, the real yield share of the 30 year Treasury and the market value calculation are Catenaa calculations derived from the cited primary sources. Nothing here is investment advice.