
April 11, 2026 – Wall Street’s revised outlook sees US exchange-traded fund assets more than doubling in five years. Active ETFs are the fastest-growing segment, capturing a third of all new flows.
In Summary
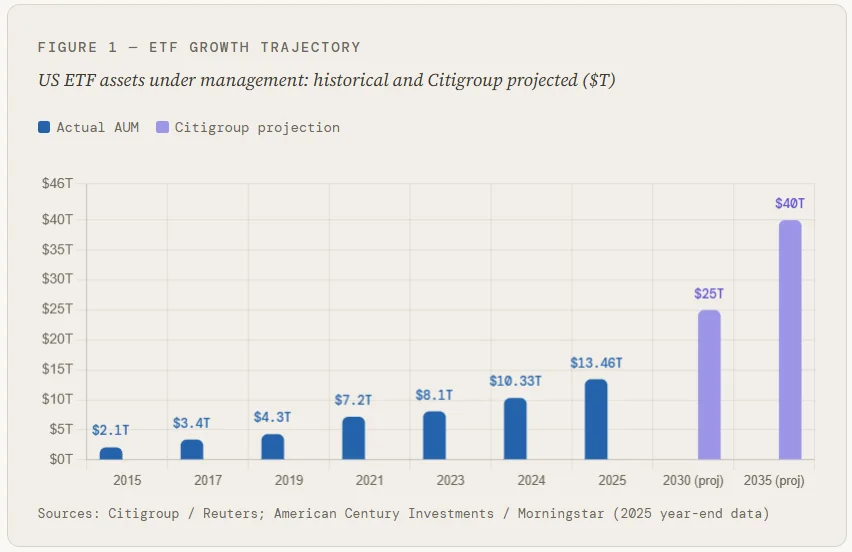
$25T by 2030: Citigroup projects US ETF AUM to more than double from $10.4T in March 2025.
$40T by 2035: Citi’s upgraded long-run target, up from its prior forecast of $29T.
Record 2025: US ETFs closed last year at $13.46T, a 30% gain on $1.48T in record inflows.
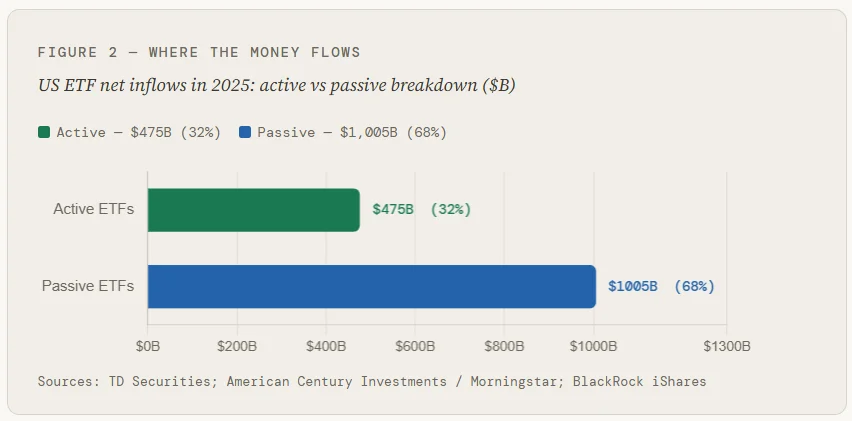
Active ETFs rising fast: They captured 32% of 2025 flows despite holding just 11% of total AUM.
Mutual fund exodus: Mutual funds shed $551B in 11 months of 2025 as investors moved to ETFs.
Global outlook bullish: PwC expects global ETF assets to reach $35T by 2030, nearly doubling from $19.5T.

The US exchange-traded fund industry is on a historic growth path. Citigroup now projects US ETF assets to hit $25 trillion by 2030. That would represent a more than 140% jump from the $10.4 trillion recorded in March 2025.
Citi also raised its 2035 target. The bank now expects US ETF assets to exceed $40 trillion by then. Its earlier forecast had set a $29 trillion ceiling for 2035. These are aggressive revisions, and the data justifies them.
A record-breaking 2025
Last year set a new high-water mark for the industry. US ETF assets reached $13.46 trillion by year-end 2025. That is a 30% year-over-year gain from $10.33 trillion at the close of 2024.
The engine behind the surge was record inflows. The industry attracted $1.48 trillion in net new money during 2025. That is the highest single-year total ever recorded. US equity ETFs alone captured over $900 billion of that sum.
Fixed-income ETFs also hit a milestone. Their assets ended 2025 at $2.27 trillion. That is a 26% jump from the prior year. Demand was broad-based, from government bonds to corporate credit.
“While these projections are more optimistic than our prior estimates, it still suggests ETFs will be in a more mature phase of AUM growth.”
— Citigroup, April 2026 research note
Active ETFs: the growth engine
The real story is active ETFs. They are outpacing their passive peers by almost every measure. In early 2026, active strategies captured 42% of all ETF flows. That is well above their 11% share of total AUM.
Active ETFs grabbed $459–475 billion in inflows during 2025. That amounts to roughly 32% of all net new ETF money. Over 80% of new ETFs launched in 2025 were actively managed. The same ratio holds in 2026 so far.
The compound annual growth rate of active ETF assets topped 59% over three years. That is nearly double the overall industry rate. Deloitte projects even stronger long-run gains.
Why this matters for investors
Citigroup attributes the ETF boom to several converging forces. Product innovation is one. Easier launch regulations are another. Demand for tax-efficient, low-cost wrappers is driving flows away from mutual funds.
During the first eleven months of 2025, mutual funds bled $551 billion in outflows. ETFs attracted $1.24 trillion over the same period. The gap between the two has grown to $1.79 trillion, up from $890 billion in 2024.
PwC’s 2026 ETF survey projects global ETF assets to reach $35 trillion by 2030. It cites tokenization and 24/7 trading as next-stage growth catalysts. The US will remain the dominant market, holding nearly 70% of global ETF assets.
Active ETFs: a $11 trillion bet
The long-term outlook for active strategies is particularly striking. Deloitte projects US active ETF AUM to grow from $856 billion in 2024 to $11 trillion by 2035. That would represent a 13-fold increase.
By then, active ETFs would hold 27% of total US ETF assets. Today, that figure stands at just 11%. The SEC’s approval of ETF share classes for mutual funds could further accelerate the shift.
Citi echoes that view. The bank expects active ETFs to double their market share over the next decade. Flexible strategies, competitive fees, and a shift from 401(k) plans toward brokerage accounts are all tailwinds.
Risks to the outlook
Not all forecasters are without caution. TD Securities flags several headwinds for 2026. Stretched equity valuations, persistent inflation, and policy uncertainty could slow organic inflows.
Market performance also matters. Even with $104 billion in monthly inflows in March 2026, US ETF assets dipped 4.6% due to market moves. AUM is not only a function of flows, but it also moves with prices.
Still, the structural case for ETFs remains intact. Low fees, tax efficiency, and daily liquidity make them hard to displace. The $25 trillion target by 2030 looks ambitious, but the data suggest it is well within reach.