
June 28, 2026 – USD/SGD slipped near 1.2960 after the Federal Reserve’s favoured price gauge softened the greenback, yet OCBC strategists warn that overbought momentum could invite fresh dip-buying.
In Summary
USD/SGD eased to about 1.2960 as US dollar momentum faded after the core PCE release.
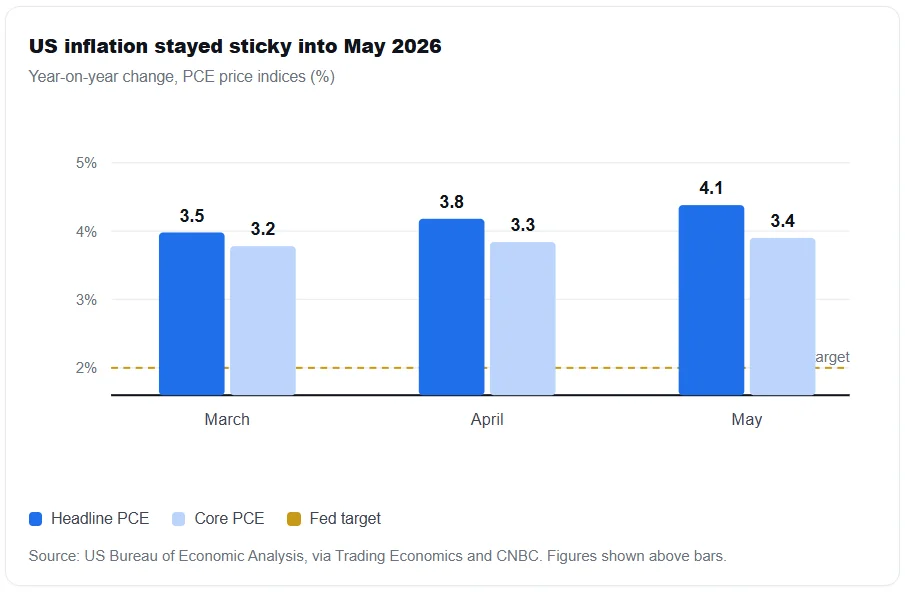
Core PCE rose 3.4% year on year in May, the hottest reading since October 2023.
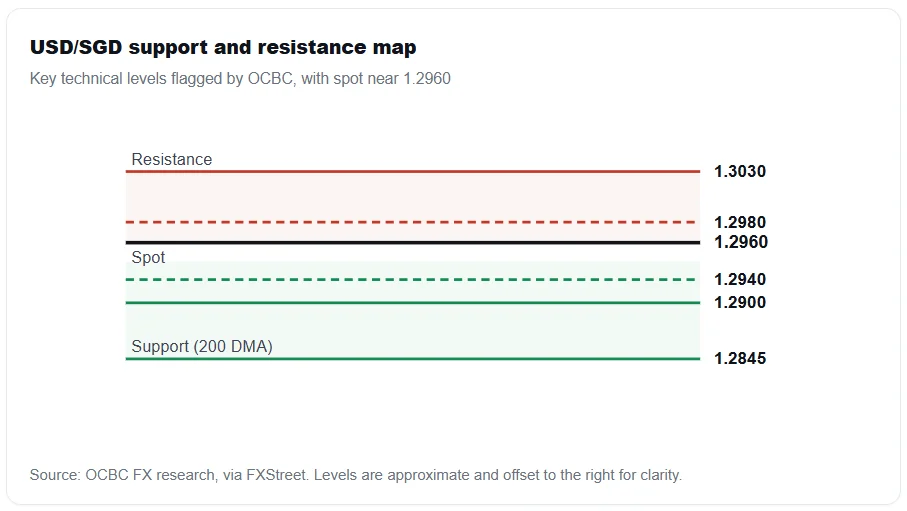
OCBC flags a turning RSI, with support at 1.2940 and resistance near 1.2980.
The Fed held its policy rate at 3.50% to 3.75% for a fourth straight meeting.
The Singapore dollar strengthened against the greenback on Friday. USD/SGD traded around 1.2960, according to OCBC strategists Sim Moh Siong and Christopher Wong. The pair had found relief overnight as the US dollar lost steam.
That softer tone followed fresh American inflation data. Therefore, traders trimmed their dollar bets and allowed Asian currencies to recover some ground. The move was modest, but the direction was clear.
Why the US Dollar Lost Its Grip
The catalyst was the core Personal Consumption Expenditures index. This gauge strips out food and energy prices. Moreover, it remains the Federal Reserve’s preferred measure of underlying inflation.
Core PCE climbed 3.4% from a year earlier in May. That marked the highest level since October 2023. In the month, prices rose 0.3%, exactly matching forecasts.
Headline PCE told an even hotter story. It accelerated to 4.1% year on year, the strongest pace since April 2023. Consequently, the report confirmed that inflationary pressures have not faded.
However, the numbers landed broadly in line with expectations. As a result, the dollar could not extend its recent rally. Markets had already braced for a firm print, so the news offered little fresh fuel.
The Pair’s Path Through June
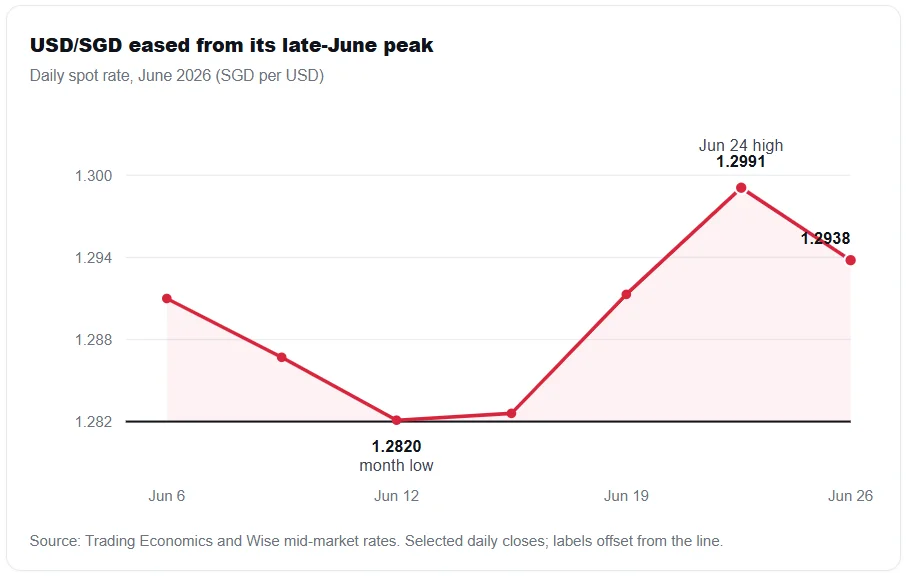
The Singapore dollar had been under pressure for weeks. Indeed, it weakened roughly 1.3% over the past month against the dollar. Trading Economics data show the pair near 1.2938 on June 26.
Over the prior week, the rate swung within a tight range. It reached a high of 1.29905 on June 24. Furthermore, it dipped to 1.29125 on June 19. The Friday recovery, therefore, reversed part of that climb.
“Bullish momentum on the daily chart remains intact, though the RSI shows tentative signs of turning lower,” OCBC strategists said.
What the Charts Are Signalling
OCBC sees a mixed technical picture. The daily trend still leans bullish for the dollar. Yet the Relative Strength Index is easing from near overbought territory.
The strategists are watching closely. Specifically, they want to know if the turn has legs. Alternatively, dip-buyers could step back in and lift the pair again.
They also flagged a calendar risk. Quarter-end and month-end flows may distort price action. Such rebalancing often pushes rates around without a clear macro driver.
Levels traders are watching
On the downside, support is at 1.2940, then 1.2900. The latter aligns with a key Fibonacci retracement. Below that, the 1.2840 to 1.2850 zone marks the 200-day moving average.
On the upside, resistance appears at 1.2980. A stronger barrier stands at 1.3030. A clean break above either level would shift the near-term tone.
The Bigger Policy Backdrop
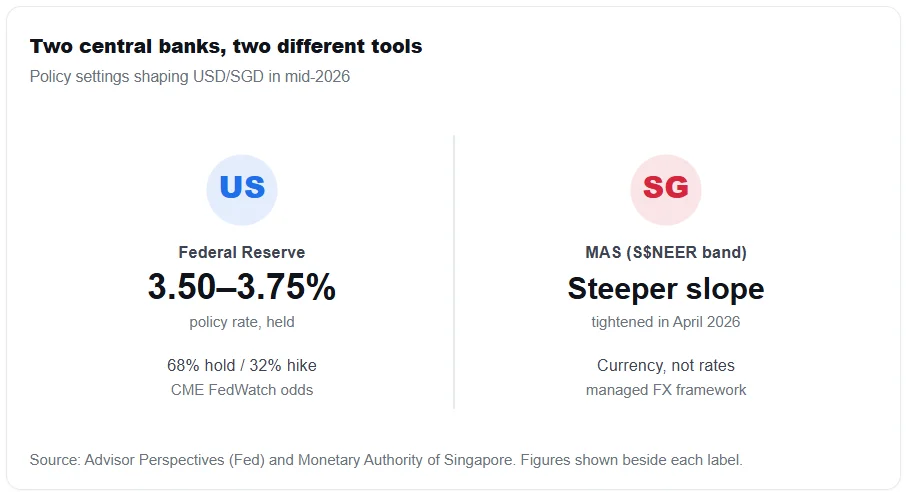
Two central banks frame this trade. On one side stands the Federal Reserve. On the other side sits the Monetary Authority of Singapore, or MAS.
The Fed held its benchmark rate at 3.50% to 3.75% in June. That marked a fourth consecutive hold. Notably, officials struck a hawkish tone and even floated a possible hike.
Markets are split on the next move. The CME FedWatch tool showed a 68% chance of another hold. Meanwhile, a 32% probability pointed to a quarter-point increase.
Singapore runs a very different system. MAS does not set interest rates directly. Instead, it steers the Singapore dollar against a basket of trading-partner currencies.
This managed band is called the S$NEER. In April 2026, MAS slightly steepened the slope of its appreciation. Higher imported energy costs drove that tightening decision.
That stance gives the Singapore dollar a structural anchor. Therefore, broad dollar weakness tends to translate quickly into SGD gains. The Friday move fit that pattern neatly.
What to Watch Next
The near-term story hinges on US data. A softer labour report could cap the dollar further. In contrast, another inflation surprise would revive hawkish bets on the Fed.
For now, the Singapore dollar holds a modest edge. Still, OCBC’s caution is worth heeding. Overbought signals can fade fast, and quarter-end noise clouds the picture.
Traders should therefore treat 1.2940 and 1.2980 as the lines to watch. A decisive move beyond either would likely set the next leg.