
A beginner-friendly guide to one of the fastest-growing corners of private credit and why investors, students, and policymakers should care.
Table of Contents
- Table of contents will be generated automatically when the page loads.
In Summary
Infrastructure debt is booming. Annual volumes have crossed USD 1 trillion globally, driven by energy transition, digitalisation, and public stimulus.
It’s a defensive asset class. Long tenors, stable cash flows, and low default rates make it attractive for pensions and insurers.
Financing evolves with risk. Grants and equity fund early stages; bank loans handle construction; bonds and institutional debt refinance operations.
The investor mix is diverse. Banks, debt funds, insurers, DFIs, and sovereign wealth funds each play distinct roles across the capital stack.
Renewables are changing the rules. Intermittent generation and negative power prices mean underwriters must model nodal prices, not system averages.
Contract design is the new alpha. A single clause in a Power Purchase Agreement can make or break bankability.
Why Infrastructure Debt Is Suddenly Everywhere
For decades, infrastructure debt was a quiet corner of finance. Only a handful of specialist banks and project sponsors paid attention. That has changed fast.
Over the past seven years, the global private infrastructure market has more than doubled. Annual transaction volume now tops USD 1 trillion, with nearly 75% of that activity concentrated in the United States and Europe. These figures come from a recent CFA Institute Research Foundation brief on infrastructure debt, which frames the asset class as the financial backbone of the clean-energy transition, the AI-driven data-centre boom, and the rebuild of ageing public services.
So what exactly is infrastructure debt, and why should everyday investors understand it? Let’s break it down.
What Is Infrastructure Debt?
Infrastructure debt is simply money lent to build or operate large, long-life physical assets. Think wind farms, toll roads, fibre networks, airports, and data centres.
These loans have three features that set them apart:
- Long duration. Tenors often run 10 to 30 years.
- Stable cash flows. Revenue usually comes from contracts, tolls, or regulated tariffs.
- Low historical default rates. The underlying assets are essential services people keep using.
That combination is why pension funds, insurers, and sovereign wealth funds love the asset class. It helps them match long-term liabilities with predictable income.
Three Forces Reshaping the Market
The CFA Institute brief highlights three macro trends driving the boom:
- Public spending waves. Programs like the EU’s EUR 800 billion NextGenerationEU fund are unleashing fresh capital.
- The green energy transition. Renewables, grids, and storage need trillions in financing.
- The AI and digital build-out. The White House’s 2025 executive order on data-center permitting shows how urgent digital infrastructure has become.
Where the Money Is Flowing
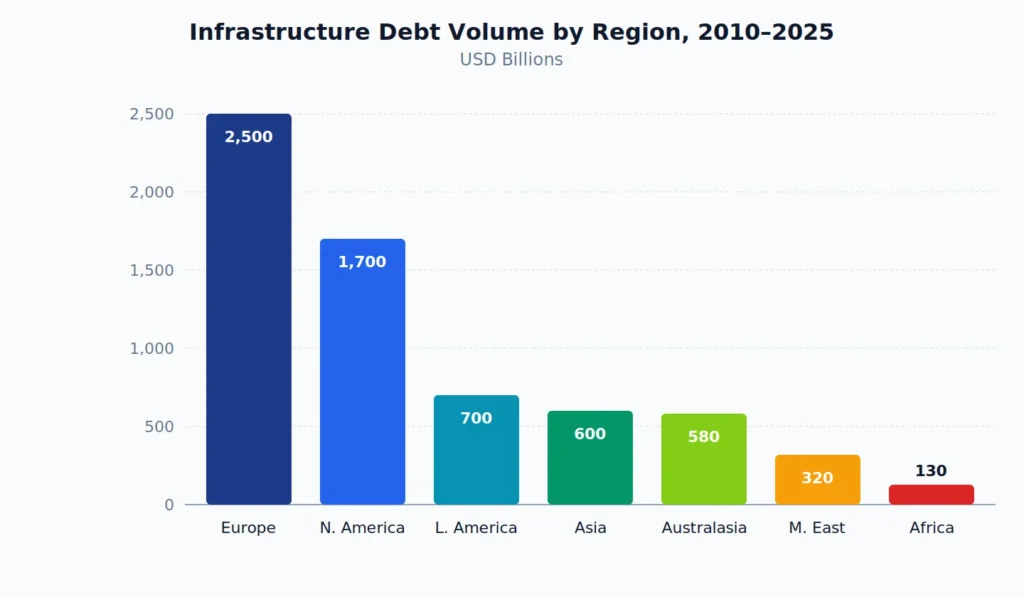
Europe leads, but Asia-Pacific carries a USD 13.8 trillion infrastructure investment gap, according to Natixis Investment Managers, a huge runway for future growth.
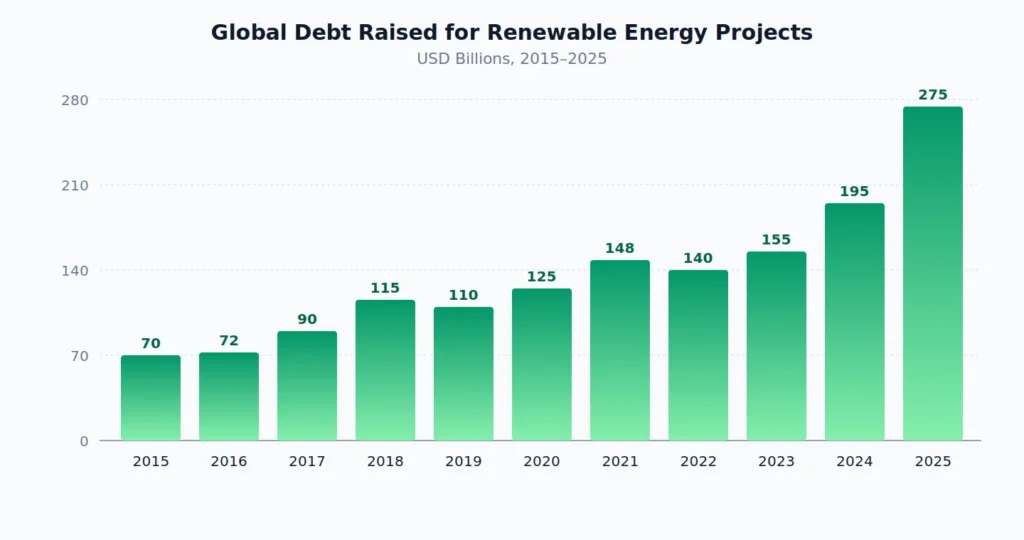
The Renewable Energy Debt Boom
Nothing captures the shift better than renewable energy financing. Debt raised for renewable projects has nearly quadrupled over the past decade.
The Project Lifecycle: Four Financing Stages
Infrastructure projects don’t get funded in one shot. Financing evolves as risk falls and cash flows appear. Here’s the typical journey:
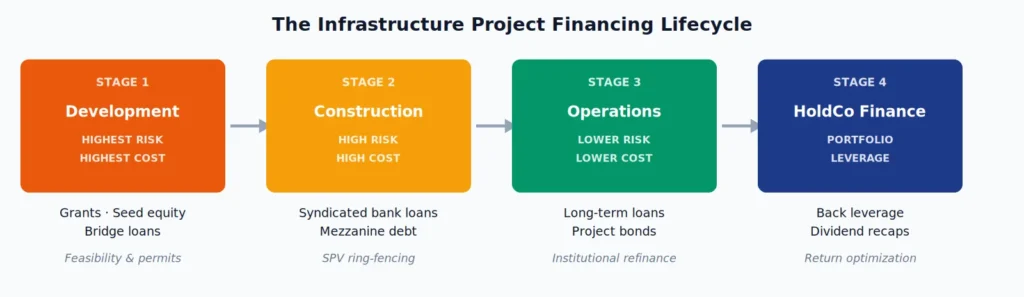
Early stages carry the highest risk and cost. Once the asset starts generating revenue, sponsors refinance with cheaper, longer-term debt, often project bonds bought by pension funds and insurers.
Who Actually Lends?
The investor base is surprisingly diverse. Each player has a specific role:
- Commercial banks dominate construction-phase lending. Basel III rules have pushed them to exit long-tenor holdings.
- Pension funds and insurers buy investment-grade senior debt for stable, inflation-linked income.
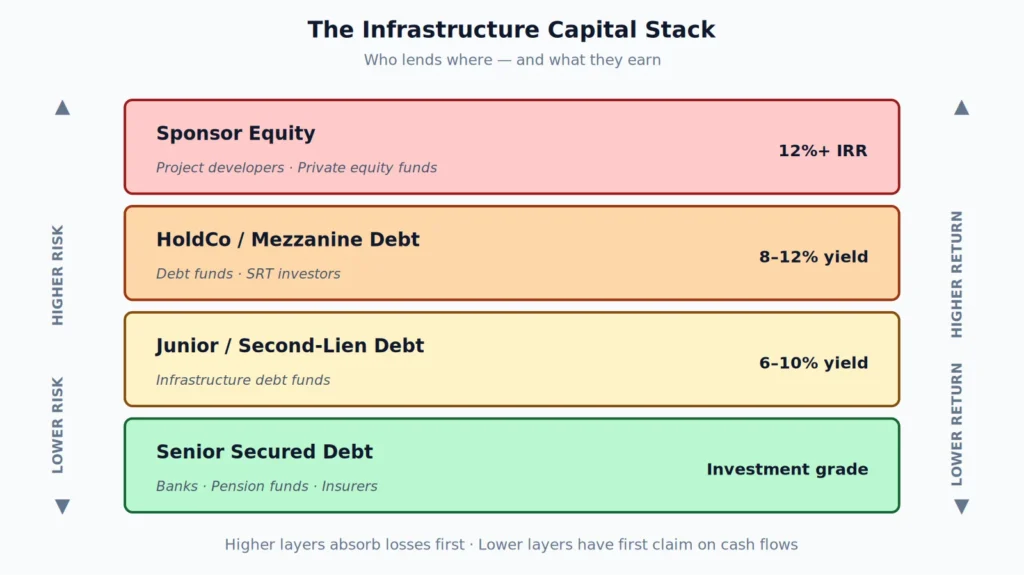
- Infrastructure debt funds target higher yields, typically 6% to 10%, through mezzanine and subordinated tranches.
- Development finance institutions like the International Finance Corporation de-risk deals in emerging markets.
- Sovereign wealth funds take strategic positions in digital, energy, and transport assets.
- Significant Risk Transfer (SRT) investors earn 8% to 12% by taking first-loss exposure on bank loan portfolios.
This diversity is the system’s strength. When one type of lender pulls back, another steps in.
The Capital Stack: Who Sits Where
Different lenders occupy different layers of the capital structure. Higher layers take more risk and earn higher returns.
The Three Sub-Sectors You Should Know
1. Energy Infrastructure
The biggest and fastest-growing slice. It covers a wide spectrum from traditional fuels to cutting-edge clean tech.
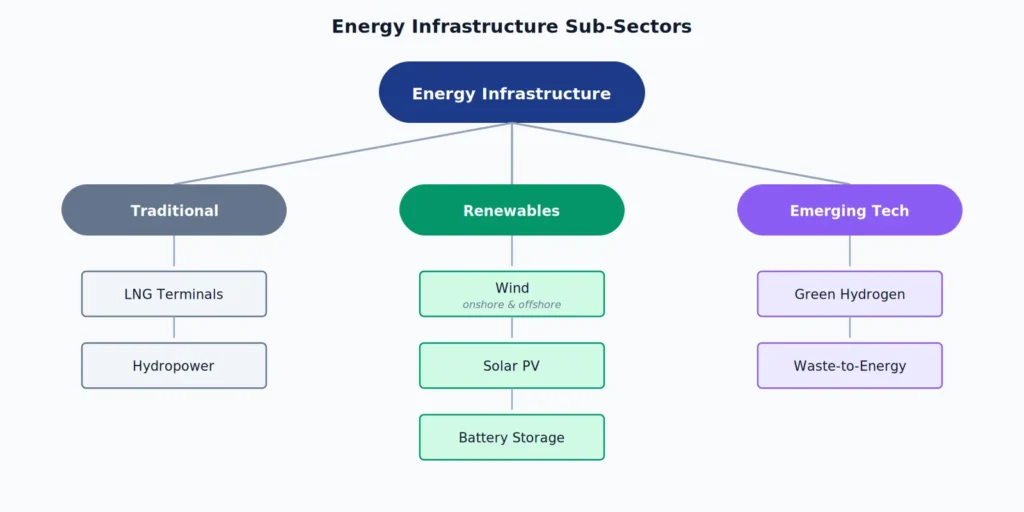
According to Global Infrastructure Hub’s 2022 monitor, renewables now dominate new project finance flows.
2. Digital Infrastructure
Fibre networks, mobile towers, subsea cables, and data centres. Revenue typically comes from long-term leases to telecoms and cloud giants, a reliable cash flow profile lenders love.
3. Transport Infrastructure
Toll roads, airports, ports, and rail. Revenue comes from user fees (tolls, fares) or government-backed “availability payments” that pay sponsors simply for keeping the asset open.
The Catch: Why Underwriting Just Got Harder
Here’s an analytical insight most casual readers miss. The old playbook for financing renewables is breaking down.
Why? Because when every wind farm generates at the same time, prices collapse, sometimes turning negative. The International Energy Agency’s Electricity 2025 report highlights that Finland recorded roughly 700 hours of negative day-ahead electricity pricing in 2024.
That means lenders can no longer assume a stable price. They now stress-test three risks:
- Cannibalisation: renewables undercut each other.
- Curtailment: grid operators force projects to shut off.
- Basis risk: local prices drift from the national average.
The fix? Smarter Power Purchase Agreements, portfolio diversification, blended finance, and reserve accounts sized for bad years. Contract design is now as important as the turbines themselves.
The Bottom Line
Infrastructure debt sits at the intersection of finance, policy, and the physical economy. It funds the roads you drive, the data centers running your apps, and the wind farms powering your home.
For investors, it offers something rare: steady income backed by real assets. For students and policy watchers, it’s a live case study in how capital markets adapt to structural change. And for everyone else, it’s worth understanding simply because it’s quietly shaping the world we’ll live in over the next 30 years.