


July 17, 2026 – A major bank warns the current pullback echoes the crashes that followed gold’s 1980 and 2011 peaks and lays out staged buy levels.

In Summary
A major bank warns gold’s correction may echo the 1980 and 2011 peaks.
Technical signals include a death cross and an RSI reading of 90.
Downside targets cluster between $3,702 and $3,250 per ounce.
The bank favours staged buying rather than exiting gold entirely.
Central bank demand and rate expectations still shape the path.
The latest gold price forecast from a major Wall Street bank warns of a deeper correction ahead. Analysts there point to eerie parallels with two historic market tops. Consequently, traders now weigh whether the current pullback marks a pause or a peak.
Why Analysts See Warning Signs
The bank’s technical team flags a cluster of bearish signals in gold. Moreover, several of these signals most recently appeared near the metal’s largest peaks. A “death cross” pattern has formed on the charts. In addition, momentum readings hit extreme levels at the recent high.
The relative strength index reached 90 at the top. Notably, that same reading appeared before the crashes of 1980 and 2011. Furthermore, net-long positioning remained elevated, a pattern that often precedes sharp reversals. Therefore, the team sees rising odds of a prolonged decline.
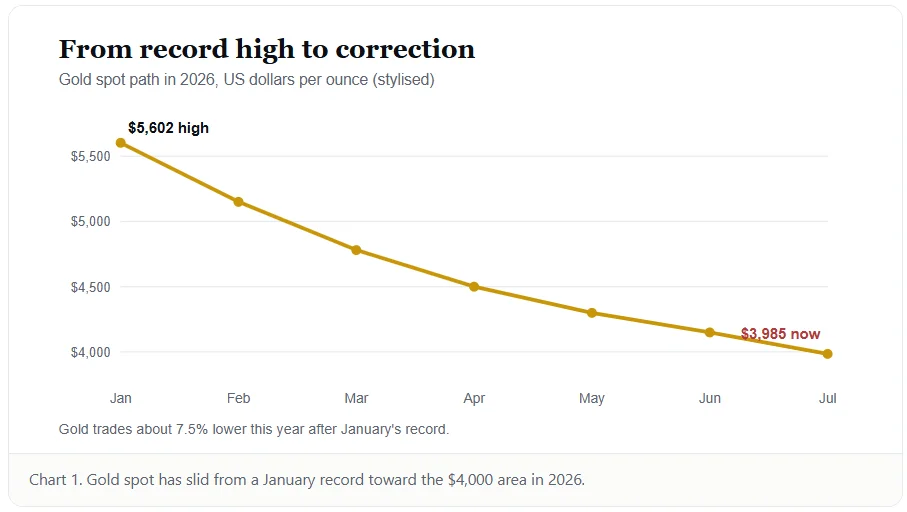
The current selloff still looks young by historical standards. Indeed, the correction is only 24 weeks old. By contrast, the advance that preceded it ran for 121 weeks. So the drop looks short relative to the long climb before it.
Lessons From 1980 and 2011
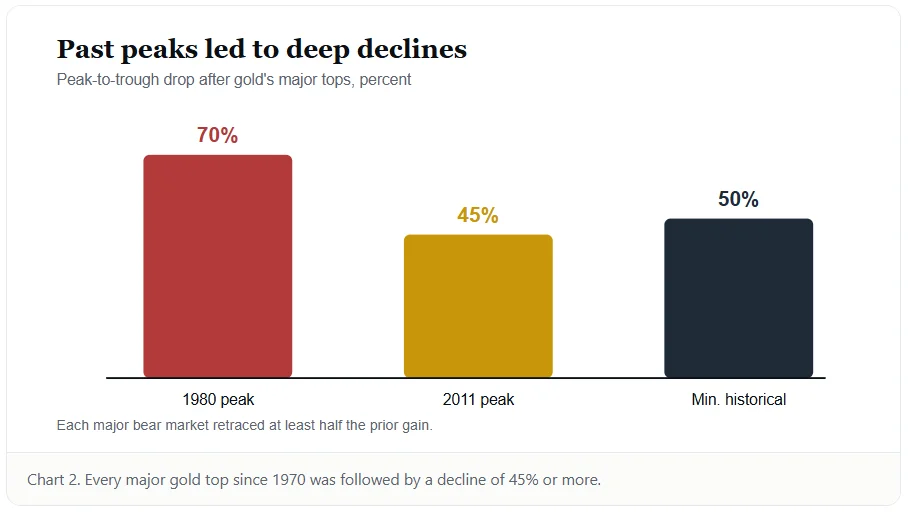
History offers a sobering guide for the current gold price forecast. Every major gold bear market since 1970 retraced at least half the prior gain. The 1980 top near $850 gave way to a two-decade slide. Subsequently, prices fell roughly 70% before finding a floor.
The 2011 peak told a similar story. Gold reached about $1,895 that September. Afterward, it dropped nearly 45% by late 2015. Because both declines followed euphoric rallies, analysts now fear a repeat pattern.
If 2026 proves to be a secular peak, the downside could reach $3,315. Meanwhile, a separate lookback method points toward $3,605. Additionally, the halfway retracement of the full advance sits near $3,702.
Every major gold bear market since 1970 retraced at least half the prior advance.
The Path May Not Be Straight
A steady drop is far from certain, however. The bank expects a near-term bounce first. Specifically, prices could rebound toward the $4,325-$4,500 zone. After that, a fresh leg lower may follow toward $3,702.
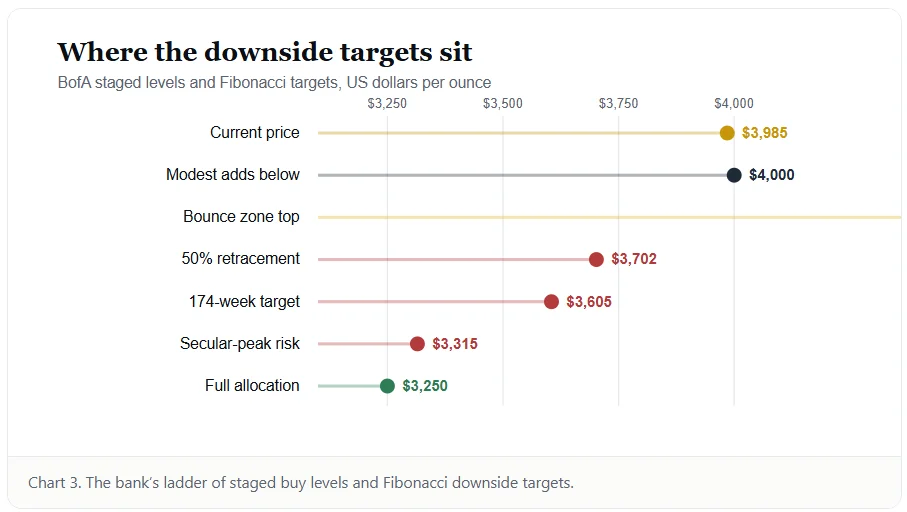
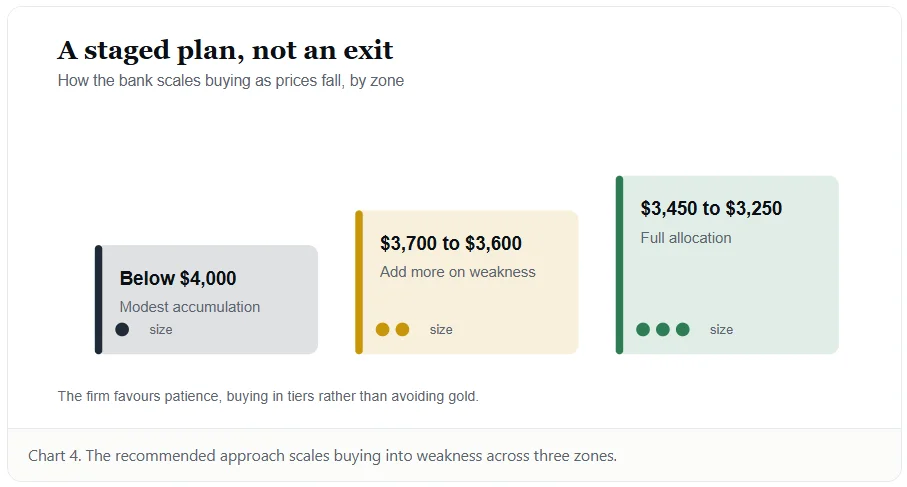
This countertrend rally could tempt buyers before the next decline. Yet the firm still favors patience over aggression. Instead of avoiding gold entirely, it recommends buying in stages. It suggests modest adds below $4,000, then heavier buying near $3,450 to $3,250.
What Supports Gold Now
Strong forces still underpin the metal despite the caution. Central banks continue to buy gold at a brisk pace. For instance, official reserves rose by a net 41 tonnes in one recent month. Furthermore, first-quarter demand ranked among the strongest starts on record.
Interest rate expectations also shape the outlook. Traders currently see the Federal Reserve holding rates steady. Because gold pays no yield, higher rates raise its opportunity cost. Nevertheless, reserve diversification continues to lend support beneath the market.
Gold trades near $3,985 today, down about 7.5% this year. The metal still sits far above its recent lows. Ultimately, the forecast asks a simple question. Is this a pause within a bull run, or the start of something deeper?