
June 08, 2026 – Investor sentiment crashed into deep “extreme fear” as Bitcoin slid toward $61,100. Record ETF redemptions and a global selloff drove the mood lower.
In Summary
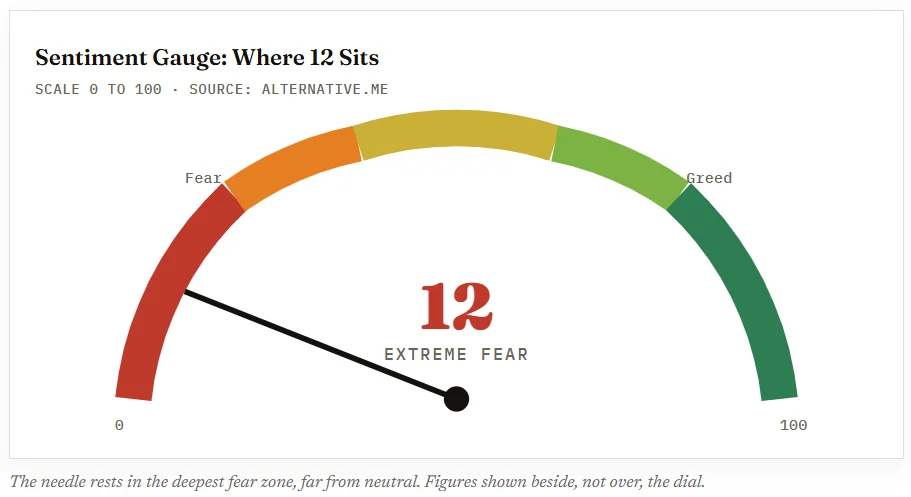
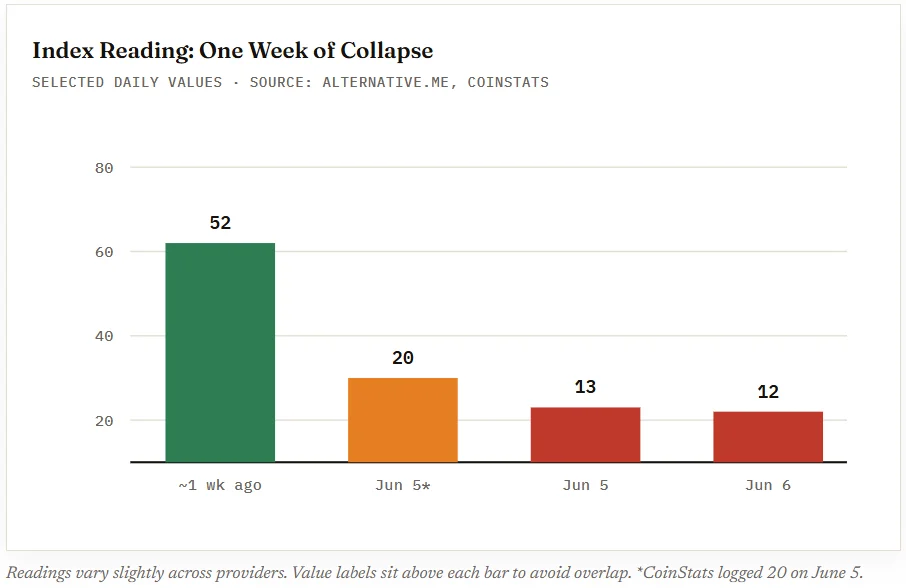
The Crypto Fear and Greed Index printed 12 on June 6, deep in extreme fear territory.
Sentiment collapsed from about 52 just one week earlier, a rare and rapid swing.
Bitcoin fell near $61,100, its lowest intraday level since February.
Spot Bitcoin ETFs bled roughly $4.4 billion across a record 13-day streak.
Total crypto market value shed about $110 billion in a single 24-hour window.
Fear now grips digital asset markets. The Crypto Fear and Greed Index dropped to 12 on June 6, 2026, according to data compiled by Alternative.me. That reading sits firmly inside the extreme fear band.
The gauge measures market mood on a scale from 0 to 100. Lower numbers signal fear, while higher numbers signal greed. A score of 12 therefore reflects unusually anxious traders. Moreover, the index slipped from 13 the previous day.
A Sharp Slide From Greed
The pace of the reversal stands out. Sentiment registered near 52 a week earlier, within the greed range. Consequently, the seven-day drop from greed to extreme fear marks a striking shift in mood.
Such swings rarely happen so quickly. Furthermore, the decline tracked a broad pullback in prices. As selling spread, confidence evaporated across major tokens.
Bitcoin Leads the Retreat
Price action explains much of the gloom. Bitcoin traded near $61,100 on June 6, its weakest intraday print since February. Earlier in the week, it had broken below $70,000.
Ether also struggled, slipping under $2,000 toward roughly $1,585. Meanwhile, major altcoins posted losses between 3% and 8%. As a result, the total crypto market lost about $110 billion in one 24-hour stretch, according to DEXTools data.
The broader picture looks heavier still. Bitcoin fell roughly 21% over four weeks, dropping from above $80,000. Therefore, the selloff ranked among crypto’s worst weekly stretches since 2024.
Record ETF Outflows Add Pressure
Institutional money also headed for the exits. US spot Bitcoin ETFs recorded 13 straight days of net outflows between May 15 and June 3. That run marked the longest streak since the funds launched in 2024.
The redemptions drained roughly $4.4 billion in total. Notably, BlackRock’s iShares Bitcoin Trust absorbed about three-quarters of that damage. Consequently, total fund assets fell from $104.29 billion to nearly $82.83 billion.
The data is consistent with historical behaviour during drawdowns. Leveraged strategies are unwinding, and supply is moving toward long-term holders.
-Analyst note via CoinShares
Ether funds mirrored the stress. They posted a 17-day outflow streak, also a record, as tracked by Galaxy Research. However, both streaks finally broke on June 4 with small net inflows.
What Drove the Fear?
Several forces combined at once. Macro worries about sticky inflation kept rate-cut hopes in check. In addition, a stronger dollar reduced demand for riskier assets. Capital also rotated toward artificial intelligence equities.
JPMorgan strategists framed the move carefully. They argued the drawdown was not purely ETF-driven. Instead, leverage unwinds and equity de-risking happened together. Thus, a single fix seems unlikely.
How to Read the Index
The gauge blends six inputs into one number. These include volatility, trading volume, social media activity, surveys, Bitcoin dominance, and Google Trends data. Together they capture mood rather than fundamentals.
Crucially, the index forecasts nothing. An extreme fear reading does not signal what comes next. Sentiment can stay low for long stretches. Therefore, traders generally treat it as one input among many.
Some investors view deep fear as a contrarian signal. Yet that view offers context, not a recommendation. For now, the market simply remains cautious and watchful.