
May 15, 2026 – Chainlink (LINK) pulls back nearly 5% this week. But ETF inflows, on-chain metrics, and the Fidelity FILQ launch signal strong underlying demand.
In Summary
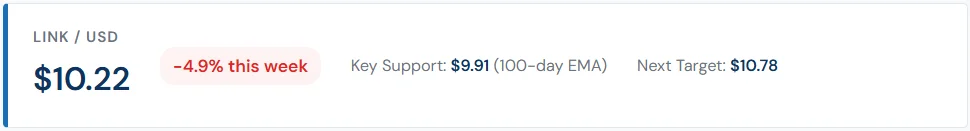
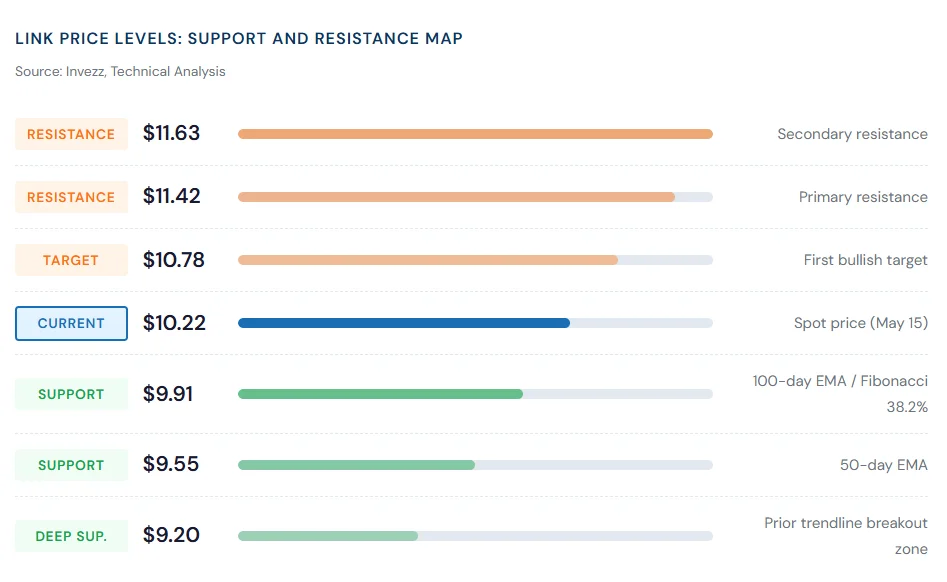
LINK trades at $10.22, holding above the critical $9.91 support level.
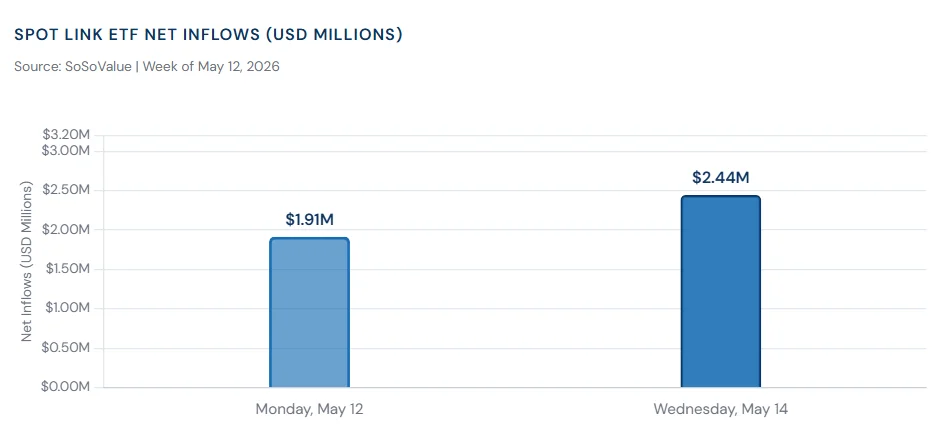
Spot LINK ETF inflows reached $2.44M on Wednesday and $1.91M on Monday.
Social dominance hit 0.232%, the highest level since November 2025.
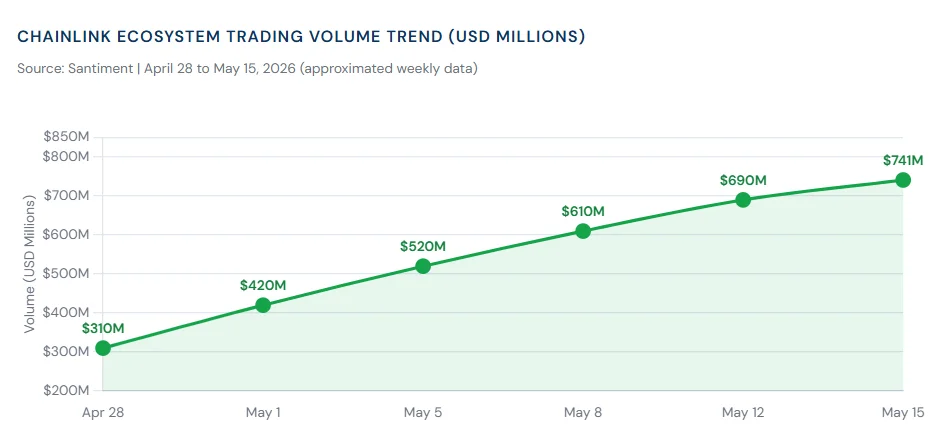
Chainlink’s ecosystem trading volume climbed to $741.06M recently.
Fidelity International launched FILQ, its first tokenized fund, via Chainlink infrastructure.
Chainlink (LINK) has corrected sharply over the past five days. The token slipped nearly 5% and approached a critical technical support zone. Yet beneath the surface, multiple bullish indicators are strengthening. On-chain data, ETF inflows, and institutional moves paint a different story.
Technical Structure: Tested but Intact
LINK currently trades at $10.22. It sits below the longer-term Exponential Moving Average (EMA). However, two key mid-term support levels remain intact. The 100-day EMA at $9.91 and the 50-day EMA at $9.55 form a layered cushion below the spot price.
Momentum indicators remain constructive. The Relative Strength Index (RSI) hovers just above 60. This level signals positive momentum without being overbought. The MACD line stays in positive territory, though its slope has flattened. This suggests a moderate, rather than explosive, upside bias.
The immediate resistance targets are clear. A push above $10.78 would be the first bullish milestone. Beyond that, $11.42 and $11.63 are the next key levels to watch.
On-Chain Metrics Signal Renewed Interest
Santiment’s Social Dominance metric for Chainlink reached 0.232% on Thursday. This is a new yearly high not recorded since November 2025. The metric tracks LINK’s share of all crypto media discussions. Rising social dominance often precedes meaningful price action.
Meanwhile, the Chainlink ecosystem’s aggregate trading volume climbed to $741.06 million. This marks a steady rise since late April. Higher-volume signals improve liquidity and trader participation. These are classic early indicators of a shift in sentiment.
ETF Inflows Confirm Institutional Appetite
US-listed spot LINK ETFs continue to attract consistent capital. SoSoValue data shows $2.44 million in net inflows on Wednesday. Monday recorded $1.91 million in inflows. This back-to-back accumulation signals steady institutional buying.
The ETF channel is significant for a clear reason. It gives institutional investors a regulated and familiar route into LINK. Traditional fund managers can access LINK without holding crypto directly. This broadens the potential investor base considerably. If inflows continue to accelerate, upward price pressure may follow.
“Spot LINK ETF inflows jumped to $11.08M in April, up from $10.82M in March. This was the first monthly increase since the $59.16M peak in December.”
Fidelity Validates Chainlink’s Infrastructure Role
Fidelity International manages over $1 trillion in client assets globally. On Wednesday, the firm launched FILQ, its first tokenized fund. The fund runs on Chainlink’s on-chain NAV infrastructure. This enables 24/7 trading and settlement for regulated yield-bearing assets.
The FILQ launch is more than a headline. It confirms that Chainlink is becoming embedded in traditional finance. Regulated institutions are now building directly on their infrastructure. This adds fundamental credibility and long-term demand for the LINK token.
Chainlink already secures over $93 billion in total value across multiple blockchains. That is more than nine times the value secured by the next largest oracle provider. Its Cross-Chain Interoperability Protocol (CCIP) is also expanding rapidly. Coinbase exclusively adopted CCIP for all wrapped assets, worth roughly $7 billion.
Key Risk to Watch
A daily close below $9.91 would invalidate the current bullish setup. Traders should watch $9.55 and $9.20 as deeper fallback zones. A broad crypto market selloff remains the primary downside catalyst.
Outlook: Accumulation or Breakout?
LINK’s current price action fits a classic accumulation pattern. The pullback is shallow. Support is holding. Fundamentals are improving. ETF inflows remain steady despite the short-term price weakness.
The Fidelity FILQ launch adds a layer of long-term credibility. As real-world asset tokenization grows, demand for Chainlink’s infrastructure grows with it. The RWA market is projected to reach between $10 and $16 trillion by 2030. Chainlink is positioned as the default oracle layer for this market.
In the short term, the focus is on the $9.91 support and the $10.78 target. A clean break above $10.78 could trigger the next leg toward $11.42. Investors watching the ETF flow data will find the clearest signal there.