

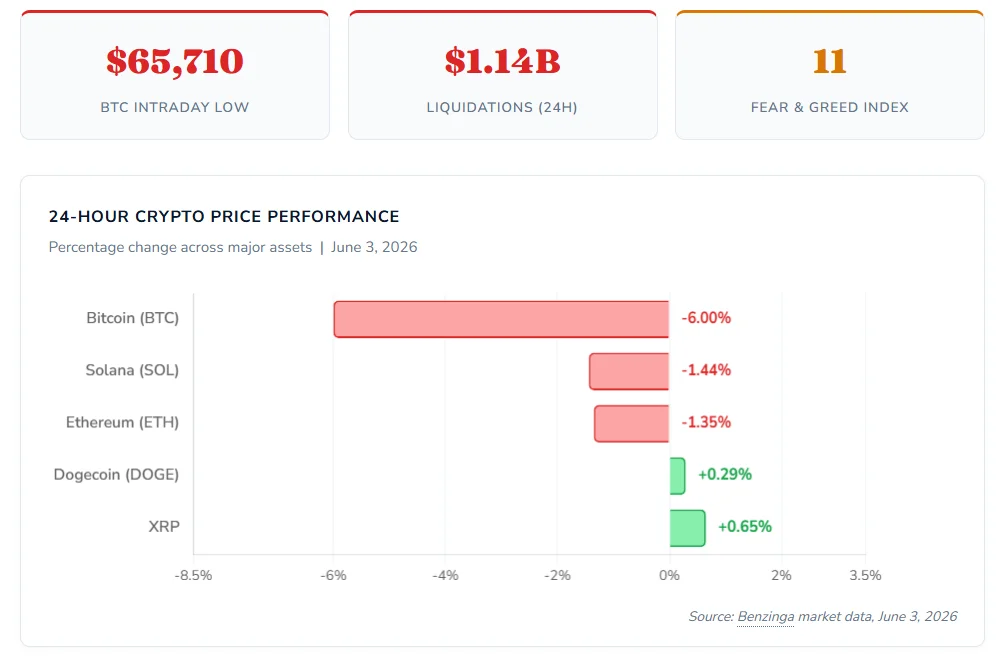
June 04, 2026 – Bitcoin fell to a multi-week low of $65,710 on Wednesday. A wave of institutional ETF outflows, $1.14 billion in forced liquidations, and a Fear and Greed Index at 11 are driving the selloff.
In Summary
Bitcoin hit an intraday low of $65,710 on June 3, 2026, a multi-week low
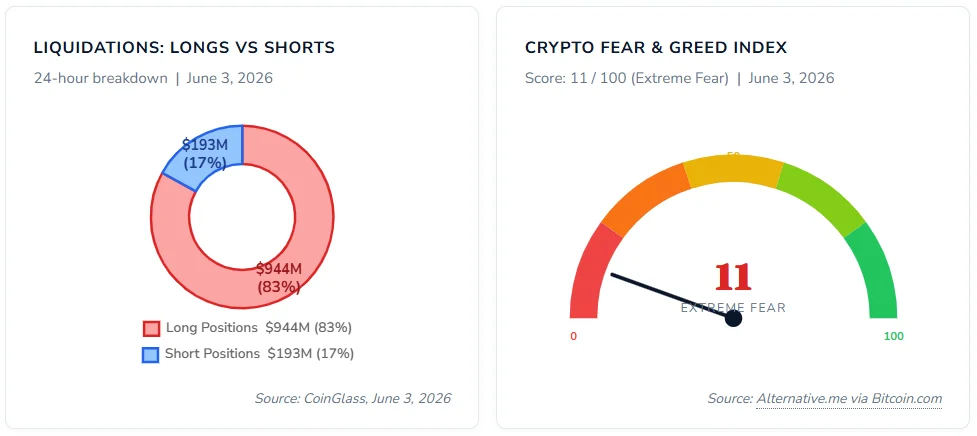
The Crypto Fear and Greed Index plunged to 11, marking Extreme Fear territory
Over $1.14 billion in crypto positions were forcibly liquidated in 24 hours
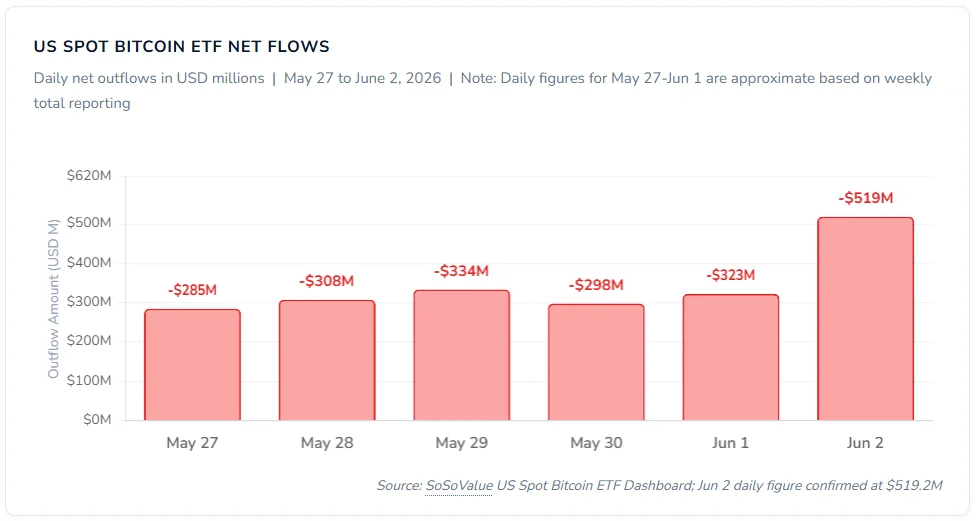
US spot Bitcoin ETFs recorded $519.2 million in outflows on June 2 alone
Three consecutive weeks of ETF redemptions have now totaled $4.21 billion
Bitcoin fell sharply on Wednesday, June 3, 2026. The world’s largest cryptocurrency dropped to an intraday low of $65,710, according to data reported by Benzinga. That level marks a multi-week price low. A broader crypto selloff followed almost immediately.
Ethereum fell to $1,829, losing 1.35% in 24 hours. Solana dropped to $73.04, off 1.44%. Meanwhile, XRP held relatively firmer near $1.22. Dogecoin traded at $0.0929. Multiple converging forces are driving the broad market decline.
ETF Outflows Accelerate the Decline
Institutional investors pulled back hard on Tuesday. According to Cryptonews.net, spot Bitcoin ETFs shed $519.2 million on June 2 alone. That single-day figure ranks among the largest outflows recorded in 2026. BlackRock’s IBIT fund took the heaviest hit, reporting $388.6 million in redemptions.
Grayscale’s GBTC added $83.5 million in withdrawals on the same day. Fidelity’s FBTC contributed a further $45.1 million in outflows. Furthermore, Ethereum spot ETFs also bled capital. They lost $90.2 million on June 2. BlackRock’s ETHA accounted for $44.27 million of that Ethereum total alone.
Three consecutive weeks of selling have now totaled $4.21 billion in redemptions. Total US spot Bitcoin ETF assets currently stand at $85 billion. That equals just 6.28% of Bitcoin’s total market capitalization. Therefore, the market treats each day of ETF flow data as a key price signal.
Liquidations Top $1.14 Billion in 24 Hours
The price decline triggered a cascade of forced liquidations. Per CryptoTimes citing Coinglass data, over 202,991 traders had positions wiped in 24 hours. Total liquidations reached $1.14 billion. Of that sum, $944 million came from long bets alone.
Short-side liquidations totaled just $193 million by comparison. That lopsided ratio confirms the market had built up heavy bullish leverage. Additionally, the largest single order struck on HTX exchange. One BTC-USDT position worth $59.67 million was eliminated in a single trade.
However, Glassnode notes this was not the deepest liquidation event on record. Events in late 2025 and early 2026 were more severe. Nevertheless, the scale confirms that excess leverage had accumulated across derivatives markets heading into this drop.
Sentiment Signals Extreme Fear
Market sentiment has deteriorated sharply in recent days. According to Bitcoin.com, the Crypto Fear and Greed Index fell to 11 on June 3, 2026. The index sat at 23 just one day earlier. One month ago, it registered 40. Therefore, the drop to 11 marks a sudden and striking acceleration in bearish sentiment.
Bitcoin’s Bollinger Band Width has also fallen to a record low. Analyst Cryptollica reported this squeeze on social media. The compression now exceeds the tight readings seen at the 2015, 2018, and 2022 cycle bottoms. Historically, such extreme compression has preceded major price breakouts. Analysts note there are higher odds of an upside resolution once expansion begins, per TradingView analyst reporting.
Technical Analyst NoteBitcoin’s monthly Bollinger Band Width has hit its lowest level on record. This level of volatility compression exceeds the lows seen at the 2015, 2018, and 2022 cycle bottoms. Such squeezes have historically preceded major directional breakout moves.
Glassnode: Fragile Structure, Weak Demand
On-chain analytics firm Glassnode describes the current Bitcoin structure as fragile. Weak demand and heavy ETF outflows define the setup. Until buyers return in meaningful size, further price declines remain possible, the firm noted.
On-chain analyst Axel Adler Jr. flagged clear risk-off signals on June 3. He reported that Bitcoin’s slow impulse indicator had collapsed to -59. That reading aligns closely with prior significant selloff periods. Consequently, the current decline appears structural rather than driven by any single event.
Price is falling, long liquidations are dominating, and ETF outflows are accelerating. Those signals together point to a broad risk-reduction phase across the market. In addition, crypto-linked equities moved mostly lower on the same day, widening the selloff beyond digital assets.
“The market is not seeing a normal pullback. Price is falling, long liquidations are dominating, ETF outflows are accelerating, and crypto stocks are mostly lower. That combination points to a broad risk-reduction phase.” – CryptoTimes Market Analysis, June 3, 2026
Key Levels and What to Watch Next
Analysts at Investing.com identify $65,000 as the critical technical support zone. A confirmed break below this level could open the path toward $60,000. However, aggressive liquidation cascades often mark local price bottoms. That creates a possible case for short-term stabilization near current levels.
The bull case rests on ETF outflows slowing or reversing. In addition, a soft US consumer price report or dovish signals from the Federal Reserve could lift sentiment. Most analysts place the near-term trading range at $65,000 to $68,000. Moreover, traders are watching the Bollinger Band compression closely for a breakout direction.
Bitcoin’s broader price structure still follows classic market-cycle mechanics. Analyst Stockmoney Lizards notes that BTC continues to respect its wider trend framework. Bull markets break resistance and expand into higher levels. Bear markets break support and move to lower ranges. Bitcoin has not yet confirmed either path. As a result, the current cycle framework remains intact for now.