


August 19, 2026 – Ten months after the October 2025 peak, Bitcoin sits near $63,000. Fund redemptions and corporate losses now set the tone.
In Summary
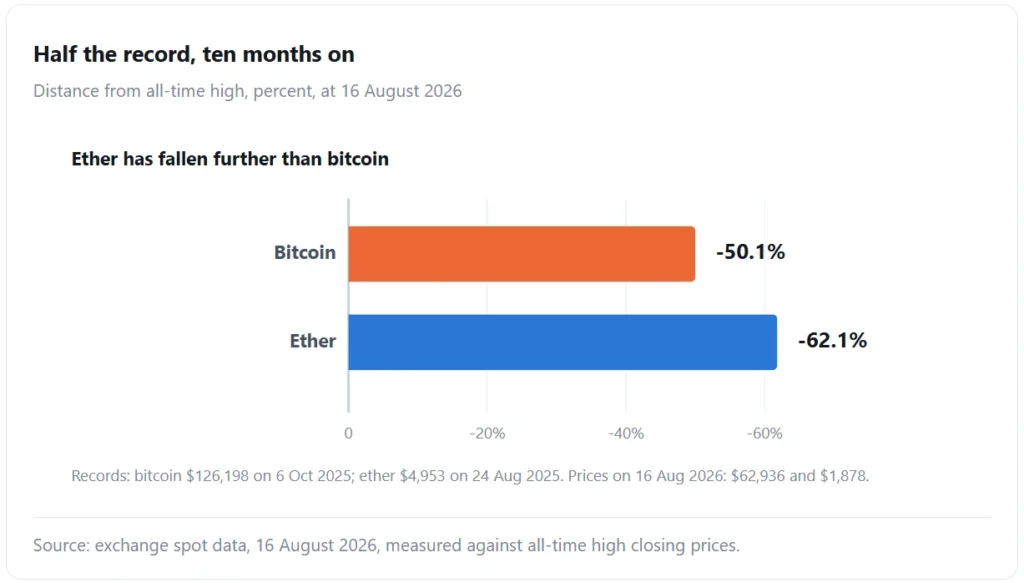
Bitcoin traded near $62,936 on 16 August 2026. That price sits about 50% below the record of $126,198 set on 6 October 2025.
Ether has fared worse. At roughly $1,878, it trades about 62% below its August 2025 peak of $4,953.
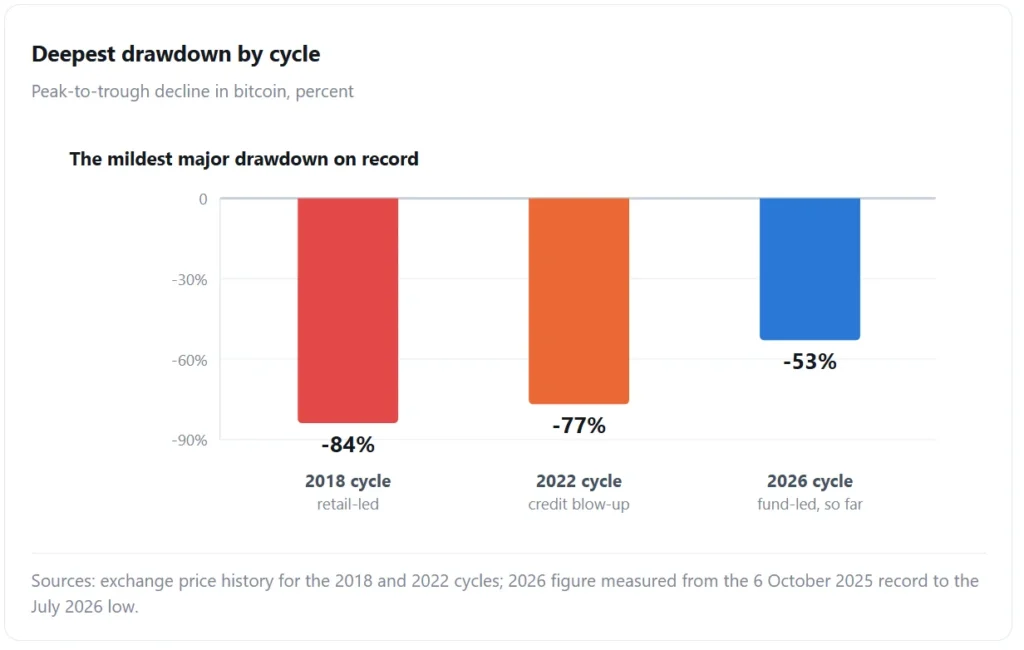
The drawdown is shallow by historical standards. Previous cycles cut 84% in 2018 and 77% in 2022.
Spot Bitcoin funds shed roughly $3.3bn in net redemptions in the first half of 2026. Selling now comes through regulated channels.
Strategy Inc reported a Q2 net loss of $8.22bn, including an $8.32bn unrealised loss on digital assets, on 30 July 2026.
Activity has thinned sharply. Daily liquidations fell to $38m, and derivatives volume dropped by half, so conviction on both sides looks weak.
This Bitcoin bear market does not look like the ones that came before it. There is no exchange collapse, no failed lender, and no viral panic. Instead, there is a slow, orderly withdrawal by the very institutions that arrived during the last bull run. That difference matters for anyone sizing a position today.
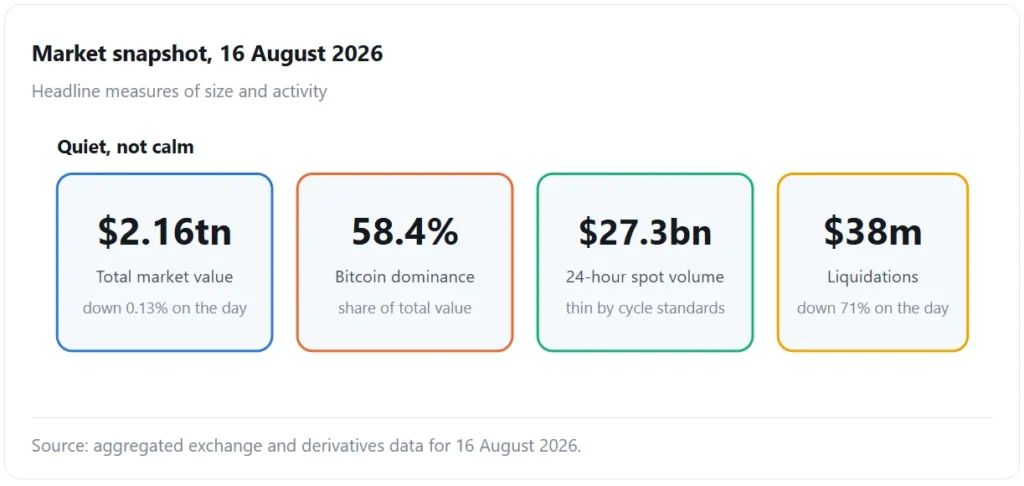
For now, prices tell the surface story. Bitcoin changed hands near $62,936 on 16 August 2026 and barely moved that day. Ether sat around $1,878, while XRP hovered just under a dollar at $0.99. Total crypto market value stood at about $2.16tn, and Bitcoin accounted for 58.4% of it.
A mild bear by historical standards
Long-time holders have seen far worse. The 2018 collapse took Bitcoin down 84% from its peak. Four years later, the 2022 unwind cut 77%. By comparison, this decline has held near 50%. Its deepest point was reached at about 53% in July, at the low of $59,000.
Shallower does not mean shorter, however. The market has now spent more than ten months below its record. Moreover, each bounce has faded well before it reclaimed prior highs.
Annual returns show the damage plainly. On 14 August, Bitcoin sat 48.6% below its level of a year earlier. Ether fared worse again, down 60.4% over the same span. As a result, most 2025 buyers now hold a loss.
The selling now runs through Wall Street
Above all, spot Bitcoin funds changed the plumbing of this market. During the first half of 2026, those funds recorded roughly $3.3bn in net redemptions. One three-week stretch ending in early June alone accounted for about $4.21bn of outflows before partial reversals.
Redemptions behave unlike retail panic. Model-driven funds rebalance on a set date and on volatility triggers. So pressure arrives in a steady drip rather than one violent burst. Consequently, the market grinds lower instead of crashing.
That pattern has a second effect. Steady selling caps every rally, since fresh supply meets each new bid. Traders therefore struggle to build the momentum that past cycles produced.
Treasury companies feel the squeeze
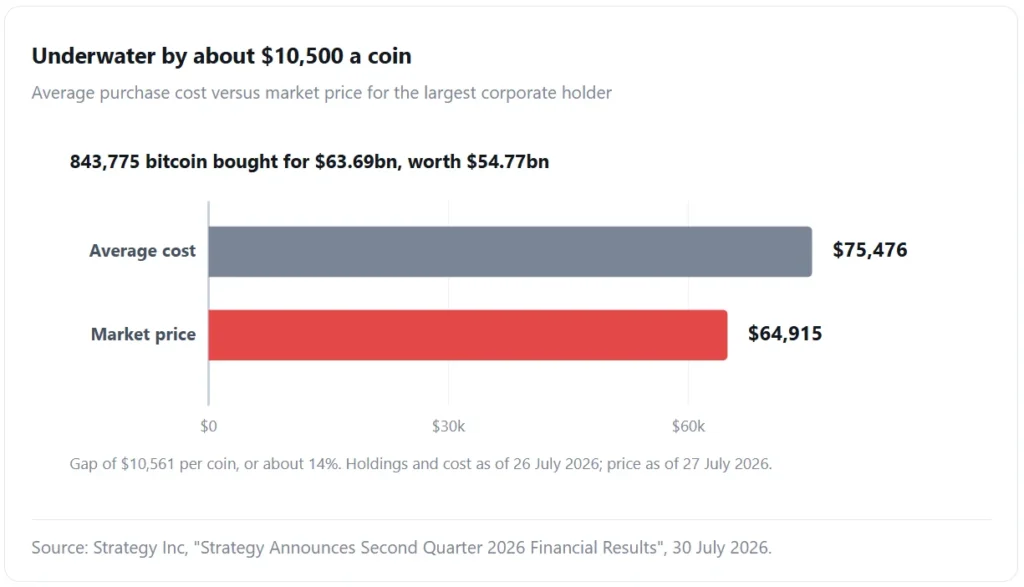
Meanwhile, corporate holders illustrate the strain. Strategy Inc reported second-quarter results on 30 July 2026. The company held 843,775 bitcoin as of 26 July, bought at an average cost of about $75,476 each, for $63.69bn in total.
At a Bitcoin price of $64,915 on 27 July, that stack was worth roughly $54.77bn. The quarter produced a net loss of $8.22bn. An unrealised loss of $8.32bn on digital assets drove that figure, against revenue of just $122.4m. Furthermore, the firm sold $218.4m of bitcoin during the year to fund preferred dividends.
Holdings still grew by 25% over the year, and the firm reported a Bitcoin yield of 4.5%. Even so, selling coins to pay dividends marks a change in tone. Investors now watch such firms as a source of supply, not only of demand.
Trading activity has drained away
In addition, liquidity tells its own story. On 16 August, total liquidations across the market came to just $38m, a 71% drop on the prior day. Long positions accounted for $24m and shorts for $14m. Derivatives volume halved to about $61bn, while spot turnover reached $27.32bn.
Thin markets cut both ways. Small flows move prices more easily. So a modest bid can spark a sharp rally. Equally, a modest sell order can break support that looked solid.
Stablecoins offer a useful read on the same trend. Total supply stood near $300bn in late July, about $10bn below the May peak. June alone saw a $7.7bn drop, the steepest monthly fall since May 2022. In short, dry powder on the sidelines has shrunk.
Usage tells a happier story. Settlement volume hit a record $1.79tn in June, up 63% from the previous month. Payments demand, therefore, keeps growing while speculative demand fades. That split is the single most important feature of this cycle.
Regulation improved while prices fell
By contrast, policy moved in the opposite direction to price. On 17 March 2026, the Securities and Exchange Commission issued an interpretation setting out how federal securities laws apply to crypto assets. It defined categories covering digital commodities, collectibles, tools, stablecoins, and digital securities.
Chairman Paul S. Atkins said the interpretation would “provide clear understanding of how the Commission treats crypto assets”. In his words, more than a decade of doubt had come to an end. Commodity Futures Trading Commission Chairman Michael S. Selig added that “the wait is over”. Clearer rules help long-term builders, yet they have not yet produced new buying.
What to watch next
Three dates sit close together. Firstly, the minutes from the July Federal Open Market Committee meeting land on 19 August. Secondly, a White House meeting on digital assets falls on the same day. Thirdly, a ceasefire deadline in the Middle East follows on 20 August.
Each event can move risk appetite quickly. A hawkish set of minutes would hurt, since crypto still trades as a high-beta asset. By contrast, a friendly policy signal from Washington could draw fresh money back.
In short, investors should judge this market on flows rather than on headlines. Sustained fund inflows would signal that institutions have finished rebalancing. Until then, a shallow bear market can still last a long time.