

August 03, 2026 – Brent crude erased a month of losses in July as the United States and Iran truce collapsed. Supermajors banked their best quarter in years. Gas markets, meanwhile, fractured into three separate price worlds.
In Summary
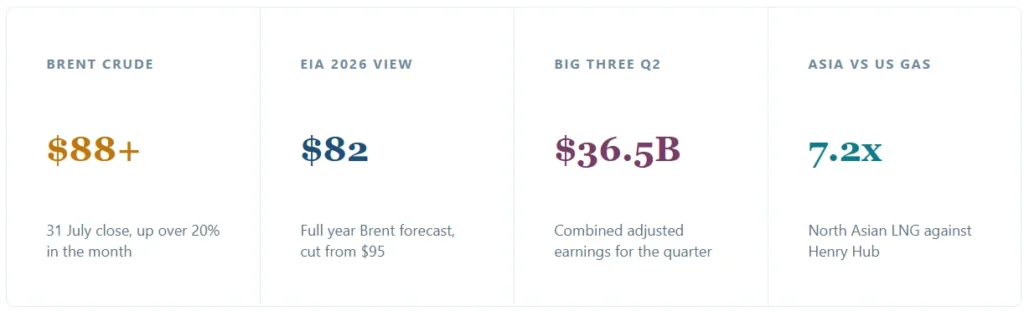
Brent crude closed above $88 a barrel on 31 July, recovering more than 20% during the month.
Washington cut its 2026 Brent forecast to $82 on 7 July, days before the truce with Tehran broke apart.
ExxonMobil, Chevron and Shell together earned roughly $36.5 billion on an adjusted basis last quarter.
North Asian buyers pay about seven times the American benchmark price for the same molecule.
OPEC+ ministers signalled a modest September increase, then a pause through the fourth quarter.
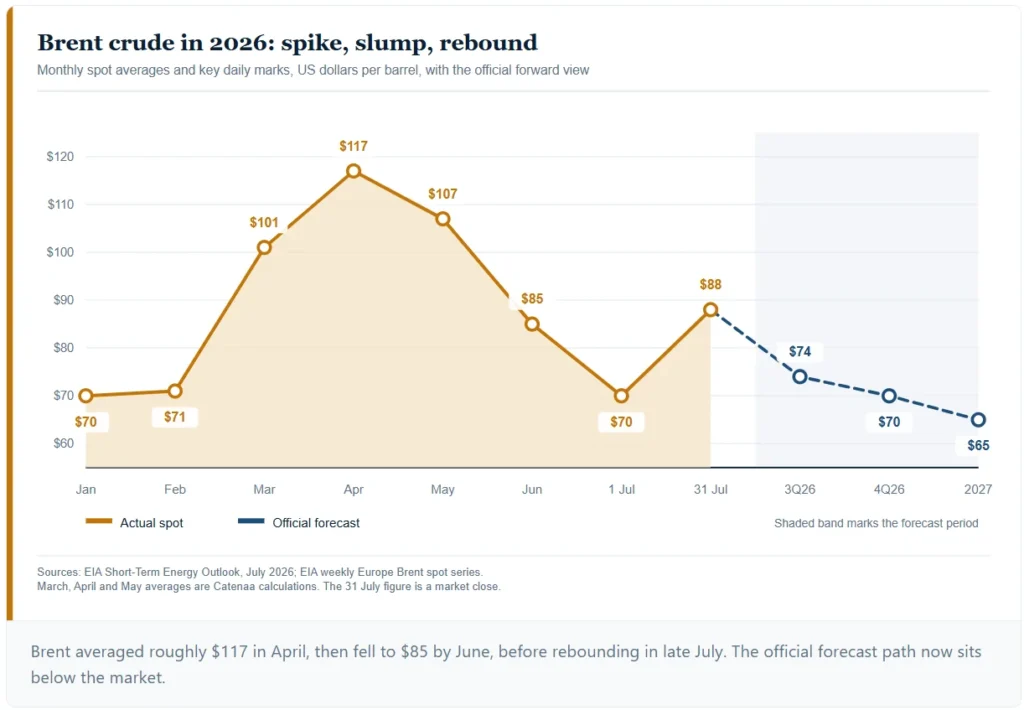
The global energy market has swung hard once more. Brent crude climbed above $88 a barrel on 31 July 2026. Furthermore, the benchmark gained more than 20% across that month. Only four weeks earlier, prices had slipped below $70. Consequently, every official forecast now looks stale.
A truce that did not survive July
Washington and Tehran signed a memorandum of understanding on 18 June. That deal promised to end the conflict and reopen the Strait of Hormuz. Tanker traffic through the waterway did pick up afterwards, according to official US energy analysis. However, the truce broke apart during July. Fresh strikes followed, and convoys again drew fire near the chokepoint.
The official forecast already looks stale
The US Energy Information Administration published its July outlook on 7 July. Analysts there cut the 2026 Brent forecast to $82 a barrel. Previously, the June outlook had pointed to $95. They also trimmed the 2027 view to $65 from $79. Notably, the agency completed that work on 1 July. Since then, the market has raced the other way. Officials expect Brent near $74 in the third quarter. Spot prices already sit well above that mark.
Supermajors bank a quarter they cannot repeat
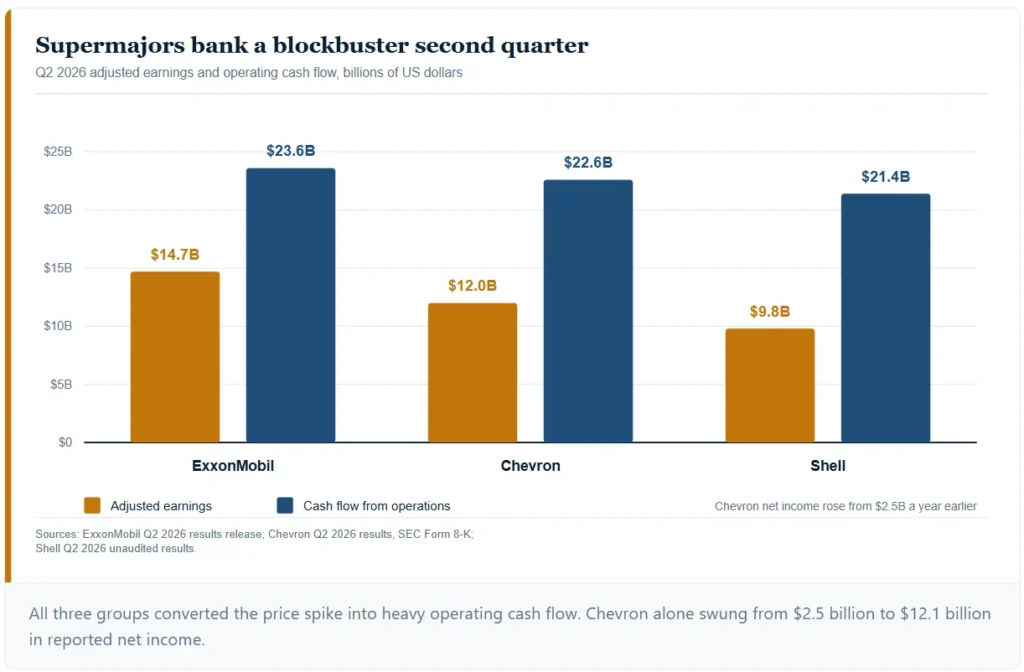
Second quarter results landed in the final days of July. ExxonMobil reported earnings of $14.5 billion, or $3.48 a share. Cash flow from operations reached $23.6 billion. Additionally, the company returned $9.4 billion to shareholders. Chevron posted net income of $12.1 billion. That figure compares with $2.5 billion a year earlier. Return on capital employed jumped to 21.4% from 6.2%.
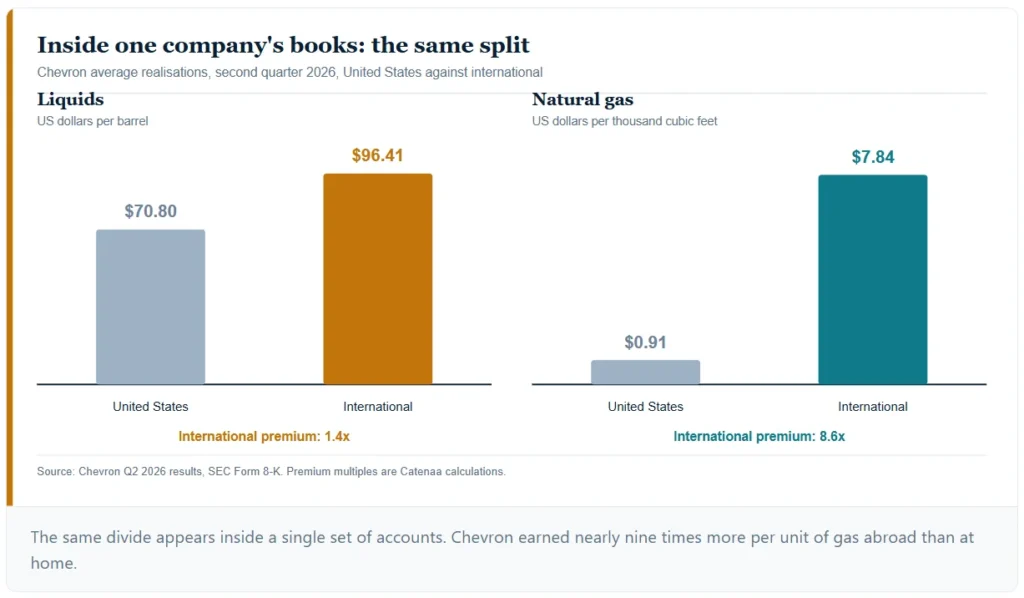
Chevron’s own filing with securities regulators explains the swing plainly. Brent averaged $104 a barrel during the quarter, against $68 in 2025. Output also rose 20% to 4.07 million barrels of oil equivalent daily. Meanwhile, its US refineries ran at a record 1.07 million barrels a day. The company then cut debt by $8.4 billion.
Shell delivered adjusted earnings of $9.8 billion. Cash flow from operations topped $21 billion. Trading desks did much of that work. Indeed, gas optimisation offset lost Qatari volumes. Management also guided 2026 capital spending to between $24 billion and $26 billion.
Here lies the catch for shareholders. These results rest on a $104 quarter. The official forecast now points to $74, then $65. Investors therefore face a peak that could fade fast.

Why the global energy market split in two
Natural gas has split into two separate worlds. Henry Hub settled at $2.95 per million British thermal units on 31 July. European gas traded near 58 euros per megawatt hour. Asian spot cargoes changed hands around $21.
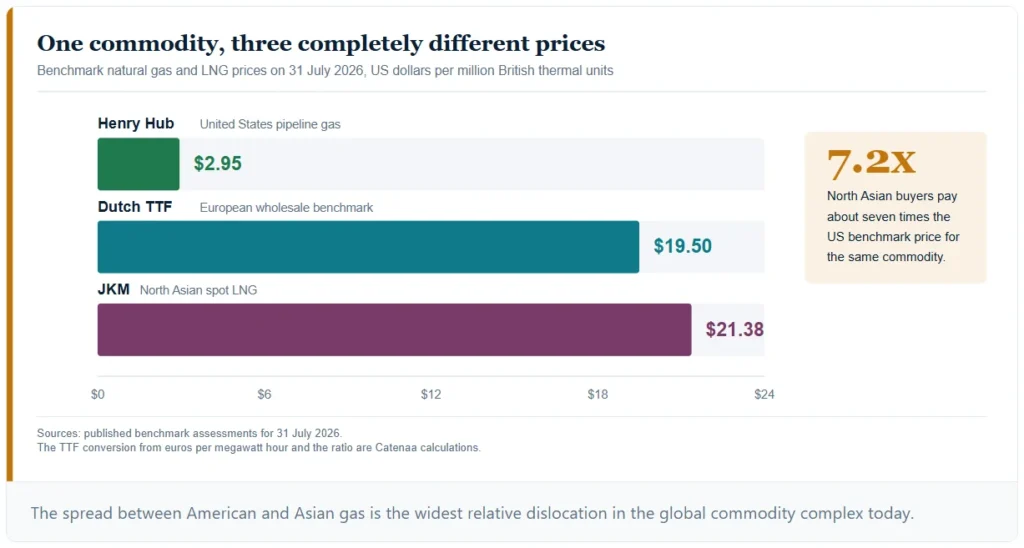
That gap looks extraordinary by any measure. Asian buyers pay roughly seven times the American price. Chevron’s US gas realisation fell to $0.91 per thousand cubic feet. Its international gas realisation reached $7.84 instead.
Two forces explain the divide. First, American producers keep setting output records. Second, Qatari cargoes still struggle to clear Hormuz. As a result, Europe entered August with storage near 55% full. Such a level sits below the seasonal norm.
Supply and demand both went backwards
Supply and demand both fell this year. The International Energy Agency counted global output of 98.8 million barrels a day in June. That marked a jump of 4.1 million from May. Still, the world pumped 9.4 million barrels a day below pre-war levels.
Demand shrank alongside supply. Analysts in Paris expect consumption to drop 1 million barrels a day in 2026. Washington sees a slightly deeper fall of 1.2 million. Both camps expect a rebound near 2 million barrels during 2027.
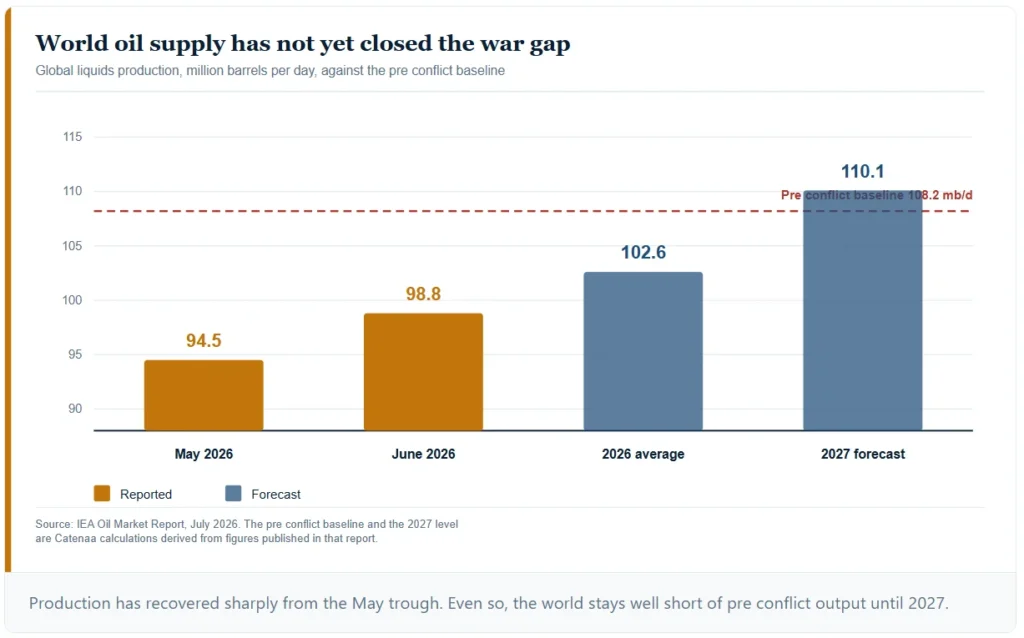
Any such rebound depends on open sea lanes. Asia carried most of this year’s demand destruction. High prices and fuel shortages caused the damage. Recovery therefore hinges on the Gulf rather than on economics.
What OPEC+ can and cannot deliver
OPEC+ ministers met by video conference on 2 August. Their July statement had already added 188,000 barrels a day from August. Delegates then signalled a similar rise for September. After that, the group looks set to pause through the fourth quarter.
The move completes a rollback of 1.65 million barrels of 2023 cuts. Roughly 2 million barrels of older curbs remain in place. Yet these increases have stayed largely theoretical. War damage and shipping risk cap actual exports. Moreover, the alliance now runs with seven core members. The United Arab Emirates quit OPEC in May.
A deeper fight looms behind the September decision. Officials are auditing each member’s true production capacity. Those audits will set quota baselines from 2027 onward. Iraq already presses for a larger allocation. Such talks could easily fracture the alliance next year.
American supply keeps growing through all the turmoil. Crude output should average 13.8 million barrels a day in 2026. Next year, that figure should reach 14.0 million. Gas shipments look even stronger. Exports should climb from 15 to 19 billion cubic feet daily by 2027. Accordingly, Washington gains leverage in every gas negotiation.
Energy stocks lead, yet valuations stay cheap
Energy has become the strongest sector in the S&P 500 this year. The largest US energy fund closed at $59.55 on 31 July. Gains for 2026 run near 29%. By comparison, the broad index has added roughly 9%.
Valuations still look modest against those profits. The fund trades near 12 times earnings. Its dividend yield sits above 2.5%. Investors clearly doubt that current margins will last.
The pivot toward powering data centres
Electricity now shapes the outlook as much as fuel. Gas holds a 40% share of US generation this year. Solar climbs toward 8%, while coal slips to 15%. Data centre demand keeps that gas share firm. Utilities across Texas already compete hard for fresh capacity.
One deal deserves especially close attention. Chevron signed a 20-year power agreement with Microsoft. The producer will supply 2.67 gigawatts to a West Texas data centre. Power will flow behind the meter, outside the public grid.
That contract points somewhere genuinely new. Oil majors want revenue that does not track crude. Data centres offer long contracts and steady demand. Similarly, gas producers see decades of firm offtake ahead.
What this means for the months ahead
Several conclusions follow for the rest of 2026. Refiners hold the strongest hand right now. Crack spreads hit four-year highs in early July. Product markets stay tighter than crude markets.
Importing nations face renewed strain. Asian economies absorbed the sharpest demand losses this year. Fuel costs there remain stubbornly high.
Households will see slower relief at the pump. US petrol averaged $4.48 a gallon in May. Officials see $3.64 for the full year. That path assumes calm across the Gulf.
Inflation watchers should stay alert too. Energy feeds directly into headline price baskets. Central banks would then rethink the easing they had planned.
Forecast risk clearly runs in one direction. Every major projection assumes gradual normalisation. Should Hormuz shut again, those numbers collapse quickly. Traders would then chase the March peak of $119.
The global energy market now trades on diplomacy, not fundamentals. Supply, demand and inventories all still matter. Yet one narrow shipping lane matters far more. Until that changes, violent swings will stay the defining feature.